Optimizing Your Core Web Vitals To Increase Your User Experience & SEO Rankings
The first step in optimizing your core web vitals performance is to measure and identify the core web vitals issues. Once the issues are identified, you can easily mitigate them by following optimization techniques like image optimization to improve LCP, JavaScript optimization to boost your INP, and visual stability optimization to enhance CLS performance.

The Economic Times, a major Indian news website, increased its user experience and reduced the bounce rate by 43% by optimizing the core web vitals, increasing LCP performance by 80% and CLS performance by 250%.
Let’s explain the Core Web Vitals, their issues, and how you can optimize them with RabbitLoader to improve your conversion rate.
What Are Core Web Vitals?
Core Web Vitals metrics refer to a set of three performance metrics that Google developed to measure the user experience based on the 3 primary conditions:
- The initial loading performance of your website
- The visual stability of your website’s page
- The user interactivity of your website.
John Mueller, the senior webmaster trends analyst clarified that the Google core web vitals are the important Search Engine Optimization (SEO) rankings factors.
However, not all metrics are created equally. Let’s see the weightage of this core web vitals matrics:
Largest Contentful Paint (LCP): 25%
First Contentful Paint (FCP): 10%
Speed Index (SI): 10%
Cumulative Layout Shift (CLS): 25%
Total Blocking Time (TBT): 30%
What Are The 3 Pillars Of Core Web Vitals?
Prioritizing the real-user experience and not just lab data, Google has set 3 metrics as the pillar of the core web vitals for analyzing the website’s performance.
Largest Contentful Paint (LCP).
Cumulative Layout Shifts (CLS).
First Input Delay (FID).
What is the Largest Contentful Paint (LCP)?
Largest Contentful Paint (LCP) is a web performance metric that measures the time (in milliseconds) it takes for the largest element to render on the web page. This LCP element is most often found on home pages, including the main image of your website, also known as a hero image.

Google sets some threshold values to categorize this LCP performance. Let’s understand this in an easy way.
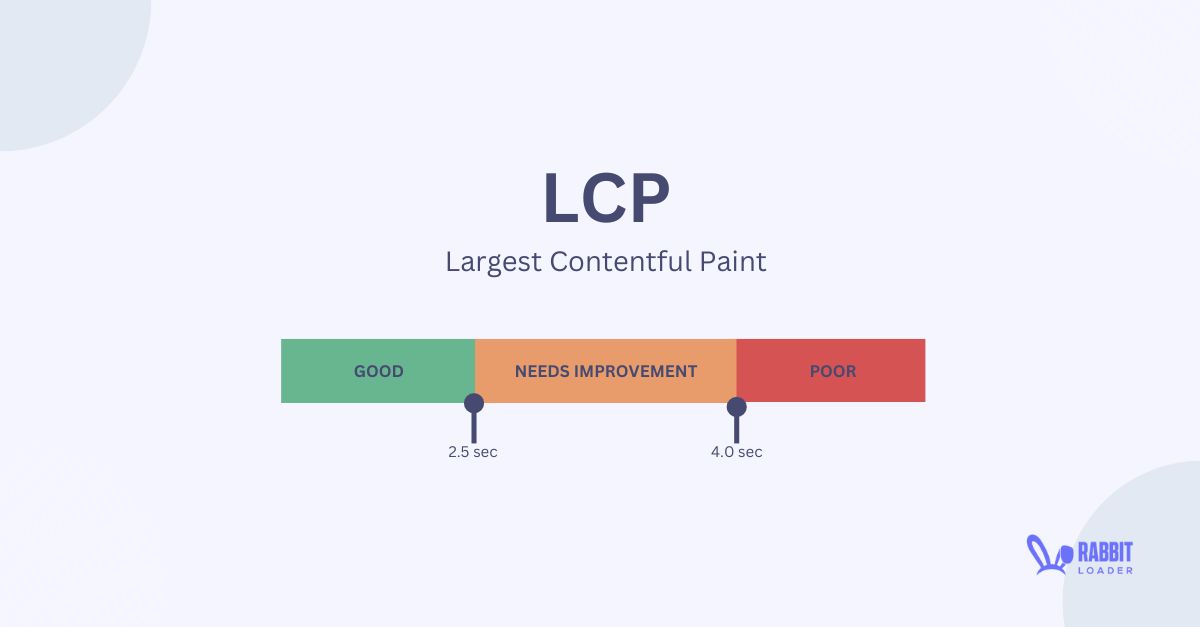
- If the LCP value is less than 2.5 seconds, Google considers this as a good LCP performance.
- The LCP value between 2.5 seconds and 4.0 seconds is considered the average LCP performance and the color will be orange. You need to improve this LCP performance to pass the core web vital test.
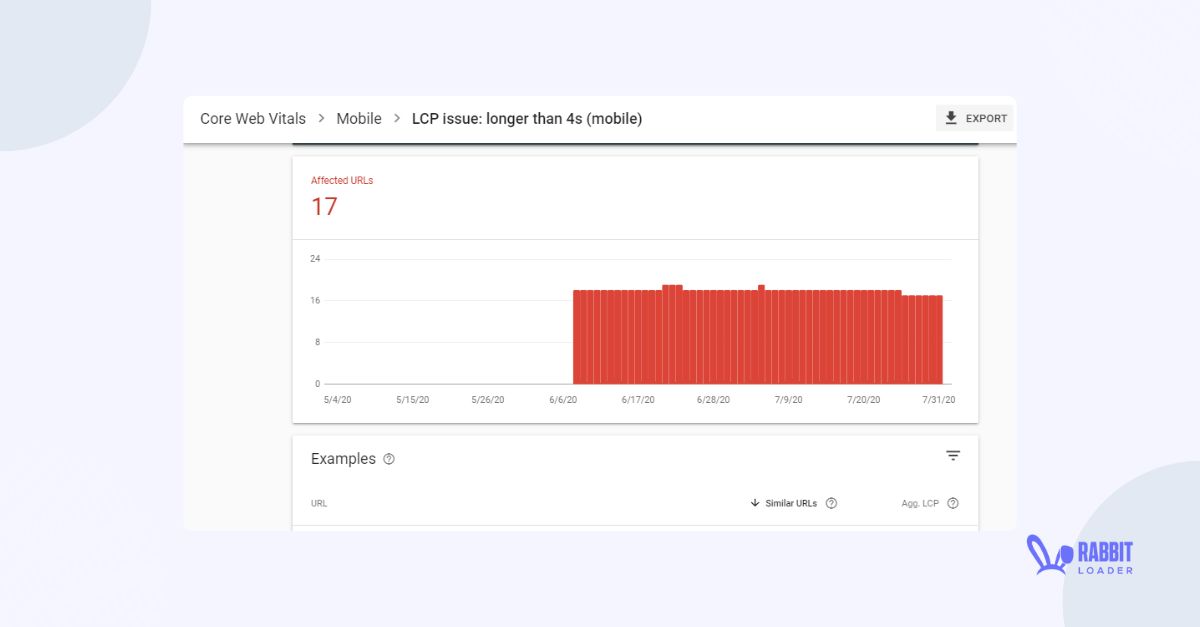
- If the LCP value exceeds 4.0 seconds, you fail the core web vitals performance.
What is the Cumulative Layout Shift (CLS)?
Cumulative Layout Shift is a user-centric performance metric that measures the visual stability of your web pages in the browser. It’s noted that this CLS is a score, not measured in seconds or milliseconds rather google uses a proprietary metric that denotes how much your visual elements move around when loaded onto the user’s browser.

- To provide a seamless experience to your user, your Cumulative Layout Shift (CLS) needs to be 0.1 or less than 0.1.
- If the CLS score is between 0.1 and 0.25, you need to improve it to achieve a good page speed score.
- A CLS score of more than 0.25 indicates the website has failed the core web vital assessment.
What is the First Input Delay (FID)?
The First Input Delay (FID) measures the interactivity of web pages. This web performance metric calculates the time from when a user first interacts with a page (like clicking a link or button) to the time the browser can respond.

Like the other two core web vitals metrics, Google categorizes the First Input Delay (FID) performance based on some threshold values. Let’s see how Google categorizes FID performance.
- If the FID value is less than 100 milliseconds, then it is considered a good FID performance, improvement is not needed.
- The FID value between 100 milliseconds and 300 milliseconds is considered average FID performance, and it needs to be improved.
- Finally, the FID value exceeds 300 milliseconds, indicating your website will fail the core web vital test.
What Is Interaction to Next Paint (INP)?
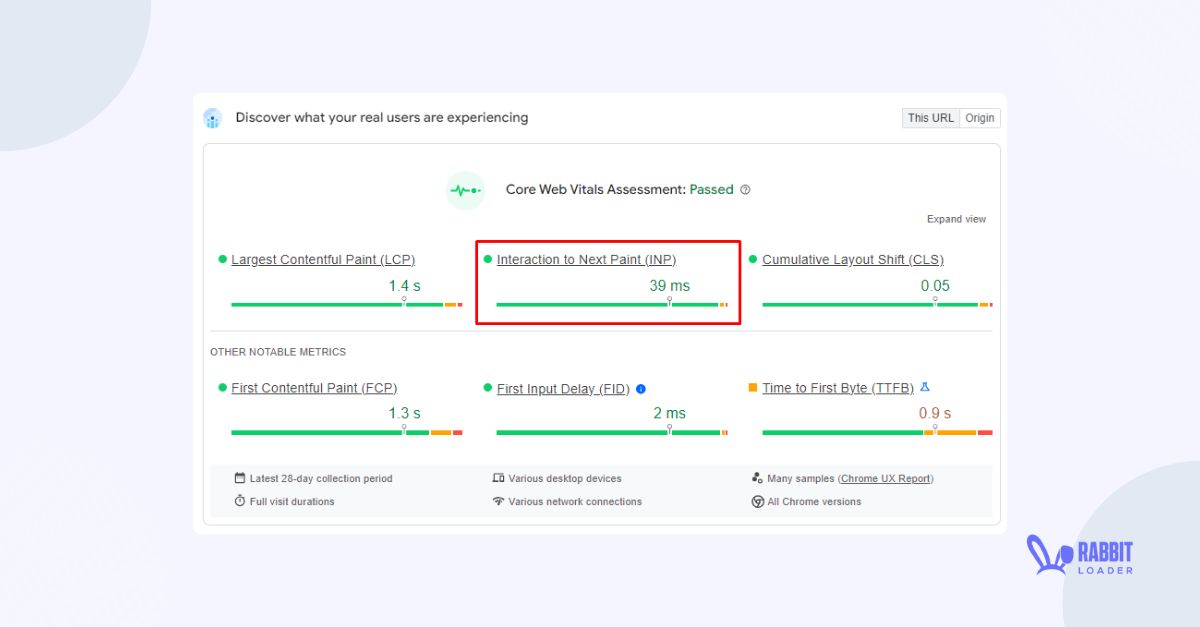
Google developed a new performance metric, Interaction to Next Paint (INP), to replace First Input Delay (FID). This metric measures a web page’s responsiveness by tracking the latency of all interactions, such as keyboard interaction and clicks, that occur throughout a user’s visit.

In simple words, INP measures the time in milliseconds, focusing on how long it takes for the next visual change to happen after a user interaction. Let’s see how Google categorizes INP performance.
- The INP value of less than 200 ms is categorized as a good INP performance.
- If the INP value is between 200 ms and 500 ms, it is considered the average INP performance.
- A more than 500 INP value indicates the website is a failure in the core web vitals assessment.
Passing Core Web Vitals: The 75th Percentile Google Recommendation
According to Google’s recommendation, to pass the core web vital assessment, your website needs to meet the specific threshold value for each metric for at least 75% of the page visits.
The Helpful Tools To Measure The Core Web Vitals Performance
Let’s mention the most helpful online tools to measure the core web vitals performance.
Google PageSpeed Insights
GTmetrix
Measuring Core Web Vitals Metrics In Google Pagespeed Insights
Google develops PageSpeed to analyze a website’s core web vitals performance based on two types of data: field data and lab data, and provide an overall performance score. In Google PSI, you also can see the core web vitals issues.

- Field data: Google collects data from the real user’s experience on a website.
- Lab data: this lab data is collected in the Google Lighthouse lab during the page speed insight test.
To analyze the performance metric, you just need to click the Analyze button after entering the website’s URL. here you can see the performance score for both devices: mobile and desktop.
Core Web Vitals Test In Gtmetrix
GTmetrix is the best alternative tool for Google Pagespeed Insight. It analyzes core web vitals performance and shows core web vitals issues. The main advantage of GTmetrix over Google PSI is that you can customize your testing. For more details, visit our previous blog.

Apart from these above tools you also can use Google Search Console, Chrome DevTools, and core web vital extension to check the loading time, visual stability, and user interaction of a website.
The Importance Of Optimizing Core Web Vitals
Before moving to the optimization technique, let’s discuss the importance of optimizing core web vital performance. By optimizing these metrics, you can provide a seamless experience to your users. It also affects your Google rankings.
Increasing the Average on-page Time
Improving the Conversion Rate
Boosts Your Google Rankings
Increasing the Average On-Page Time
Every user expects a well-functioning website. Users are more likely to stay on a website if it takes less time to load, which indicates a lower bounce rate, increasing the average on-page time on a website.
Improving the Conversion Rate
The conversion rate indicates the percentage of visitors who convert to potential leads by completing the desired action. This action includes booking an online appointment, purchasing an online product, downloading any PDF, and more.

The conversion rate is linearly proportional to the bounce rate. Therefore, optimizing the performance of core web vitals can reduce the bounce rate and dramatically increase the conversion rate.
According to a case study, Vodafone increases the conversion rate by 8 % just by optimizing its core web vitals.
Boosts Your Google Rankings

As we discussed earlier, Google considers core web vitals an essential factor in determining rankings. Therefore, optimizing these performance metrics can significantly improve your Google rankings and increase organic traffic.
What Are The Most Common Core Web Vitals Issues
Let’s discuss the factors that cause the WordPress core web vitals issues so that you can optimize these metrics by solving the core web vitals issues.
The Most Common LCP Issues
Simply, LCP calculates the initial page loading time. The most common reason for slow initial loading time is to use unoptimized images, shared WordPress hosting, unnecessary large CSS and JS files, and more.
- Adding Unoptimized Images
Adding high-resolution images can improve your website’s visual appearance, but they increase the file size, which can affect page speed and bandwidth. Therefore, it takes more time to render the most significant elements on the webpage.
- Using A Shared WordPress Hosting
Using shared WordPress hosting may increase the server response time. Many website owners use cheap shared hosting to save money, but it can affect their website performance by increasing the LCP time.

- Not optimizing HTML, CSS, and Javascript Files
Many developers prefer to use line breaks, white spaces, comments, and meaningful variable names to increase the readability of code. However, browsers don’t need to parse to render the web page.
Therefore, these unnecessary characters increase the HTML, CSS, and JavaScript file size and slow the initial loading time.
The Most Common INP Issues
Let’s explore the most common reasons for poor INP performance, which includes
- Unoptimized JavaScript Code
Developers use JavaScript for user interaction. However, unoptimized JavaScript code can be considered a render-blocking resource due to blocking the main thread. Blocking the main thread can harm your INP performance by increasing the response time.

- Using too Many third-party Scripts
Third-party scripts are often used to optimize website performance. However, these plugins also have their own stylesheets and scripting files that need to be executed during page rendering.

Therefore, using too many third-party scripts can significantly impact the website’s performance.
The Most Common CLS Issues
Due to a poor CLS score, your page can be shifted during the lifespan of the page, which leads to a high bounce rate and lower conversion rate. Let’s discuss the most common CLS issues, which include:
- Using unoptimized web fonts:

Many website owners use web fonts to customize their websites, which may cause visual distractions, such as Flash Of Un styled Text (FOUT) and Flash Of Invisible Text (FOIT). This affects user experience and increases the bounce rate, leading to a poor CLS score.
- Adding images without set dimensions:
Another reason for a poor CLS score is using the images without setting the proper dimensions. Determining an image’s width and height is an essential step in maintaining layout stability.

Without these two attributes, width and height, a browser wouldn’t set the appropriate amount of space for the image during its web page’s rendering time. Therefore, Shifting the images can also harm the page’s stability, indicating a poor CLS score.
Optimizing Your Core Web Vitals With RabbitLoader
After identifying the core web vitals issues, you, as a website owner, need to fix them to increase the user experience. Here we will discuss the non-coding and effortless solutions. So, let’s explore how RabbitLoader mitigates these web vitals issues.
How Does RabbitLoader Mitigate the LCP Issues?
- RabbitLoader optimizes images by converting them into the AVIF and WebP formats. This reduces the size of images without sacrificing their quality. This will help you reduce the page size and mitigate the “avoid enormous network payload” warnings in Lighthouse.
- Apart from this image optimization, RabbitLoader also adds a lazy loading to increase the initial loading time by deferring below-the-fold images.
- RabbitLoader generates a separate file for the critical CSS and reduces the initial loading time by almost 90-95%, improving the LCP performance.

- By adding the browser caching mechanism, RabbitLoader stores a website’s static assets and reduces the server response time. By doing so, you can easily mitigate the most common PSI warning “reduce initial server response time”.
- Through its in-build premium Content Delivery Network (CDN), RabbitLoader distributes the frequently assessed resources into the proxy/ edge server.
- RabbitLoader reduces the size of HTML, CSS, and JavaScript files by deleting unnecessary characters from the coding file. This is known as the minification process. Thus, the execution time would automatically reduce, improving the loading time.
How Does RabbitLoader Improve the Performance of INP?
- As discussed, a large JavaScript file is the main culprit of the poor INP score because it would block the main thread. So RabbitLoader defers the JavaScript functions which are not required for the initial page rendering time.
- RabbitLoader allows multi-threading, which means if the main thread is busy we can use other threads simultaneously

By allowing multi-threading in JavaScript, RabbitLoader can easily resolve the most common warnings, such as “minimizes main-thread work,” “avoid long main-thread tasks,” and “reduce initial server loading time.”
- RabbitLoader mitigates the “remove unused CSS” warning by removing the CSS rules or styles that are not utilized on the website. Therefore, it would automatically improve the website’s initial server response time by improving the INP performance.
How does RabbitLoader increase the CLS score?
RabbitLoader helps you to improve the user experience by improving the CLS score. Let’s see how.

- When you are using RabbitLoader, it automatically resizes your images for each screen size to prevent the shifting issue, improving the CLS performance as well as the user experience.
- The advantage of using RabbitLoader is that it can load images and videos with a loading animation, which helps to minimize slow-loading content.
Conclusion
You need to optimize a website’s Core Web Vitals in order to increase the page’s responsiveness, visual stability, and loading speed. This can improve user experience and help boost conversion rates.
By improving the core web vitals, you can mitigate Google Pagespeed Insights‘ common warnings such as “removed unused CSS,” “minimizes main-thread work,” “avoid long main-thread tasks,” “reduce initial server loading time,” “avoid enormous network payloads.”
If you also come across the above warnings and you are trying to mitigate these by optimizing core web vitals, don’t waste time on unfruitful solutions. Install RabbitLoader and provide a seamless experience to your users in just a couple of minutes.