Get The Best PageSpeed Score
For Your WordPress Website

What Is Web Performance? And How To Improve It In 5 Minutes?
Web Performance is the measure of how fast your website is. Similar to the performance of a car, the website performance is more than just the speed.
For a car, only being super fast is not enough. You have looked into the agility of the car & driving experience, too.
Similarly, the web performance of a website doesn’t only depend on how fast the website loads but also on how quickly the website becomes interactive & responds to user actions.
That is How quickly the buttons on the website become clickable & if it animates as soon as you click on it, these seemingly small details are vital user experience signals.
These signals cannot be overlooked when measuring and improving the web performance of your website.
In this article we would only answer the most searched questions on web performance, like what is Web Performance? What Are The Web Performance Metrics? and also mention the web performance optimization techniques to improve the performance of your website.
But if you just need a quick fix for your web performance issues for your WordPress or WooCommerce, I recommend you to install the RabbitLoader plugin, by the time you would read the next few paragraphs of this article your web performance would already be optimal.
If you are on other CMS or platforms like Shopify, Php or Laravel I have linked the appropriate RabbitLoader SDKs & app for you.
But if you really want to dive deep into web performance, read on, you would not be disappointed.
Page Contents
Why is Good Web Performance Important?
Organic Ranking:
A good performance is part of the page experience, which is a major ranking signal for google. Higher search ranking helps your business get more valuable organic traffic.
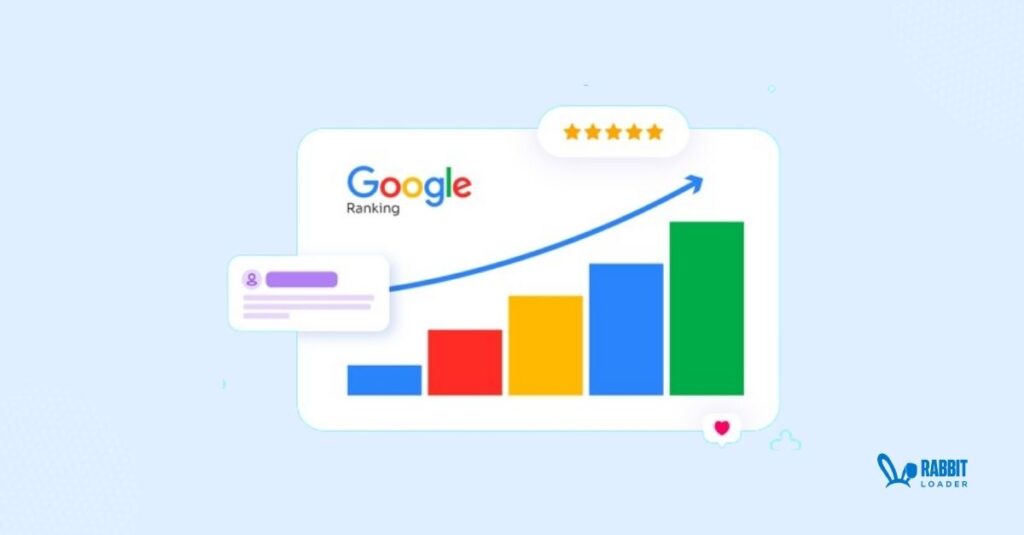
Grab your free traffic source with a good web performance.
User Experience:
In this age of AI everyone expects to see the information as quickly as possible on their screens, be it a blog or ecommerce store, most visitors won’t wait for your pages to load, it should load as soon as possible.
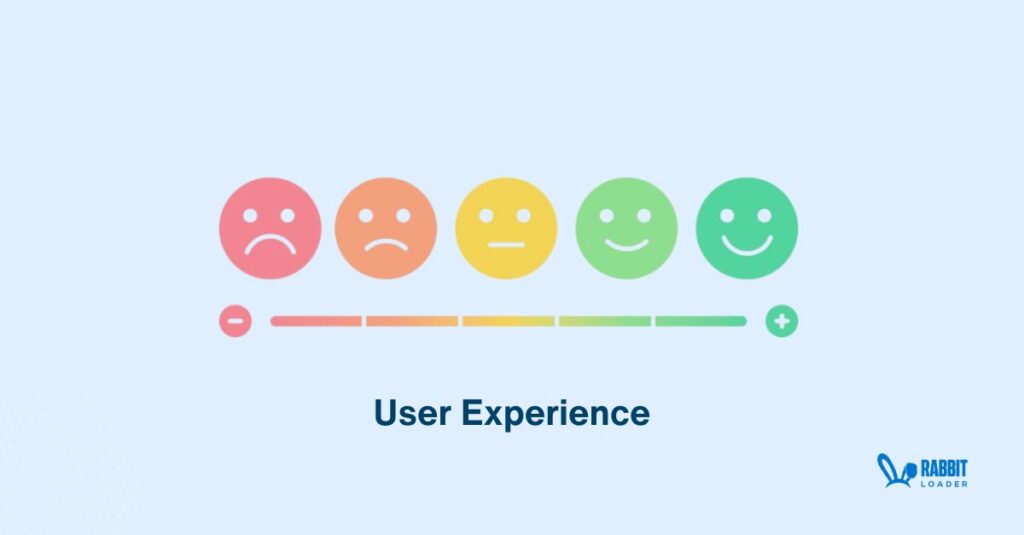
A quick website would deliver a higher quality user experience building trust in your brand with the visitors.
Low Bounce rate:
When a user lands on your website and leaves without taking an action like browsing , clicking a link or a button the event is called a bounce.
The more users do that the more your bounce rate would increase, if you visitors are not interacting with your website they aren’t buying or filling that lead form.
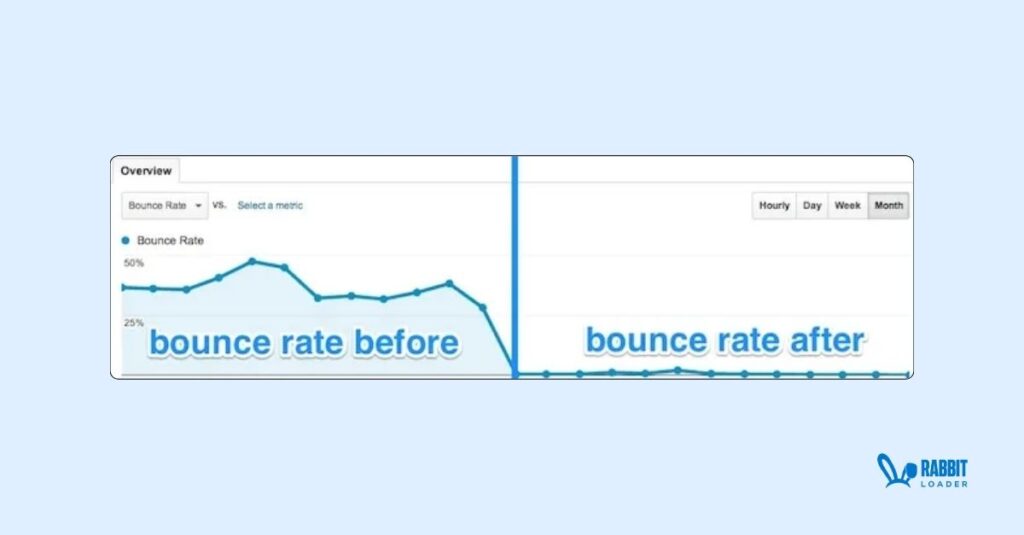
Having a high performing website lowers your bounce rate & gives your website the competitive edge it needs to make more sales.
Conversion rate:
Average conversion rate for any ecommerce store is between 1% to 3% , though it could be hugely different depending on the niche & target demographic of the website, at the end of the day you want a higher conversion rate.
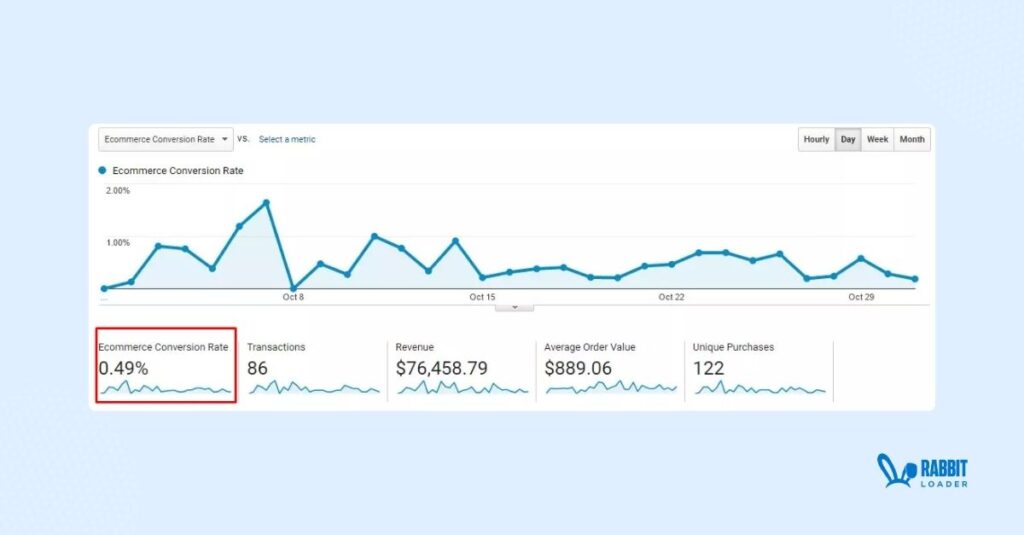
But, what do you need to do in order to get more of your visitors to become buyers?
Try by improving your bounce rate and user experience, both are tied to your website’s performance.
Revenue:
At the end of the day success of a business depends on generating revenue, and improving the web performance metrics start a chain of positive reinforcements on your website that leads to improved conversion rates & higher revenues.
Check this Amazon study where they found out delaying your website loading just by 100 ms would reduce your revenue by 1%. Now imagine what 1 or 2 seconds delay can do to your website’s revenue.
What Are The Key Web Performance Metrics?
Web performance metrics are a set of performance indicators which signals the status of your website.
Going back to our analogy of the car, the car enthusiasts among us would like to know the 0 to 60 KM ( Miles for our American counterparts) time for a car, power and torque figures to gauge the performance of the car.
Some of these indicators are underlying reasons for the car doing good (or not so good) in the 0 to 60 time.
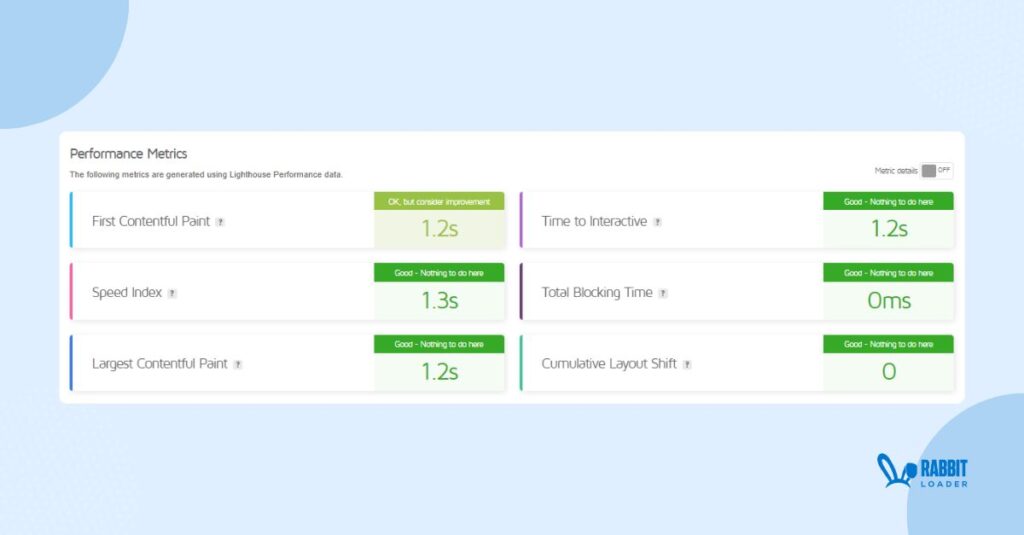
Similarly for your website there are performance indicators known as web performance metrics.
Some of those web performance metrics like PageSpeed is similar to the 0 to 60 time, and then there are underlying metrics for that performance score like FID, LCP, CLS and more.
We have created a cheat sheet of the Web performance metrics which you can download, it mentions each key performance metrics and their benchmark values.
These web performance metric benchmarks indicate where your website’s performance needs to be to achieve a good performance score.
What Is The Benchmark For Web Performance?
The benchmark for a car to be considered a supercar is to reach 0 to 60 miles per hour in just 3 seconds, similarly for a website to be considered a high performing website there are certain performance standards it must pass.
For example, to pass a website is considered a fast loading website if it loads completely within 3 seconds.
Get The Best PageSpeed Score
For Your WordPress Website
Likewise,for a website to be considered to have good performance it must score over 90 on the PageSpeed Insights test.
Below I have added a list of key website performance indicators and their benchmarks. The goal of performance optimization is to achieve if not do better than the benchmark values.
Web Performance Metrics Cheat Sheet
Cheat sheets are popular on the internet, it allows you a concise path to your goal.
We have created our own web performance metrics cheat sheet for you. Here you can find the key website performance, their benchmark values, for your website to be a high performing website.
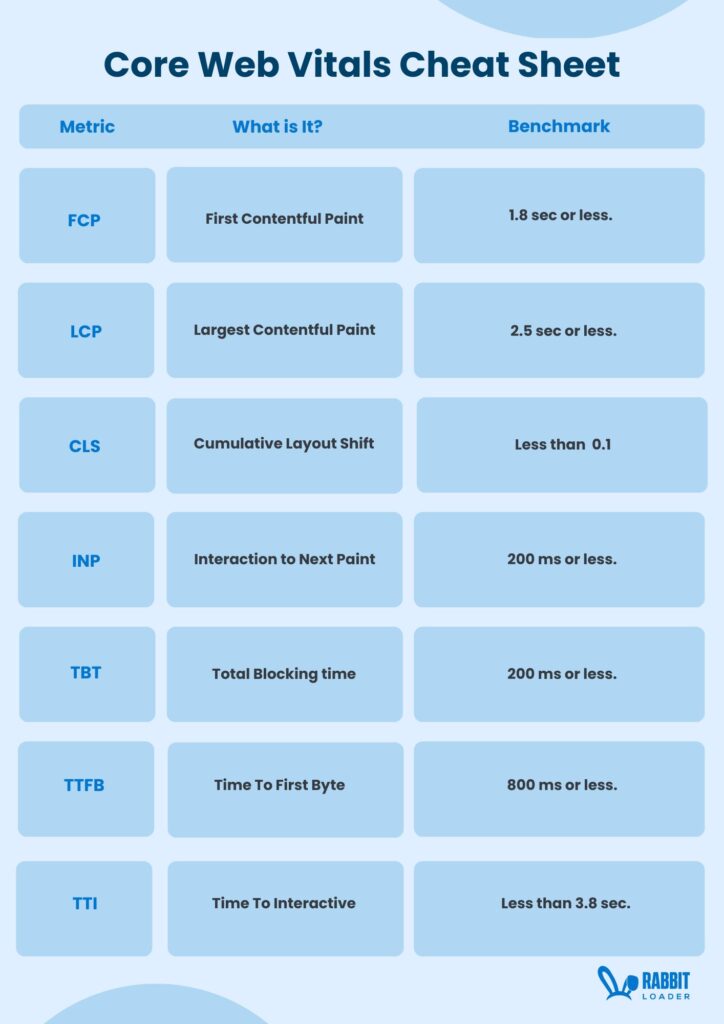
Download the cheat sheet and improve your web performance metrics by implementing the optimizations mentioned in this blog.
List Of Key Web Performance Metric.
Here’s a list of website performance metrics, it would help you understand what they really measure & the benchmark value your website should try to achieve for each of them.
- Page Load Time: Page load time is the time a webpage on your website takes to completely load. Although the metric is valid for most of the page, it is most important for your homepage & other landing pages.

Benchmark: The goal of performance optimization is to load pages on your website within 3 seconds.
Not being able to load a web page within 3 seconds might result in an increase in the bounce rate.
- First Contentful Paint (FCP):
First Contentful Paint as the name suggests measures the time it takes for the first glimpse of content to appear on your website, which could be any piece of content including a piece of text or an image.
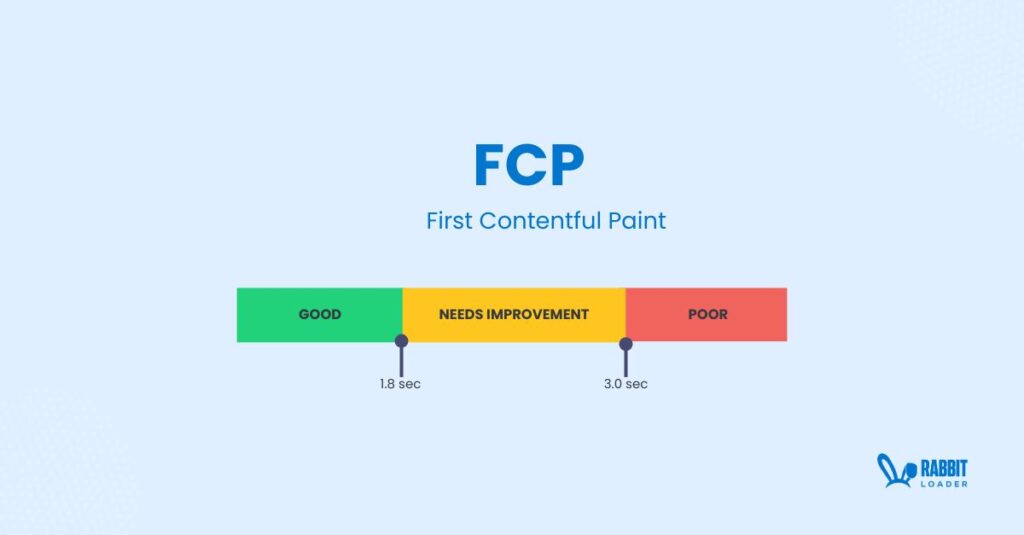
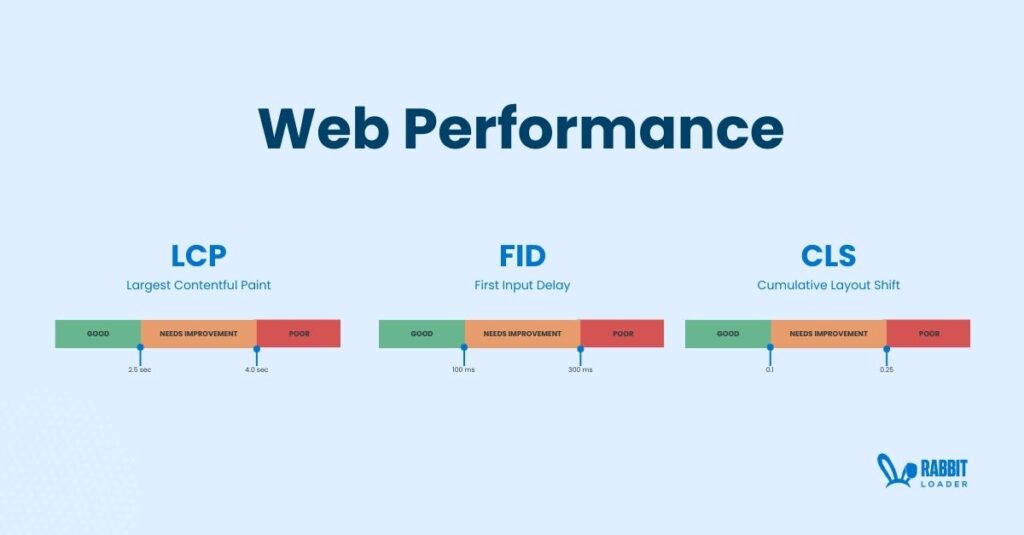
Benchmark: The FCP should be 1.8 seconds or less for your webpages.
FCP has a weightage of 10 in the PageSpeed score, hence a low FCP would impact your PageSpeed score.
- Largest Contentful pant (LCP):
Largest Contentful Paint is a measure of time it takes for the biggest content element on your website to load completely.
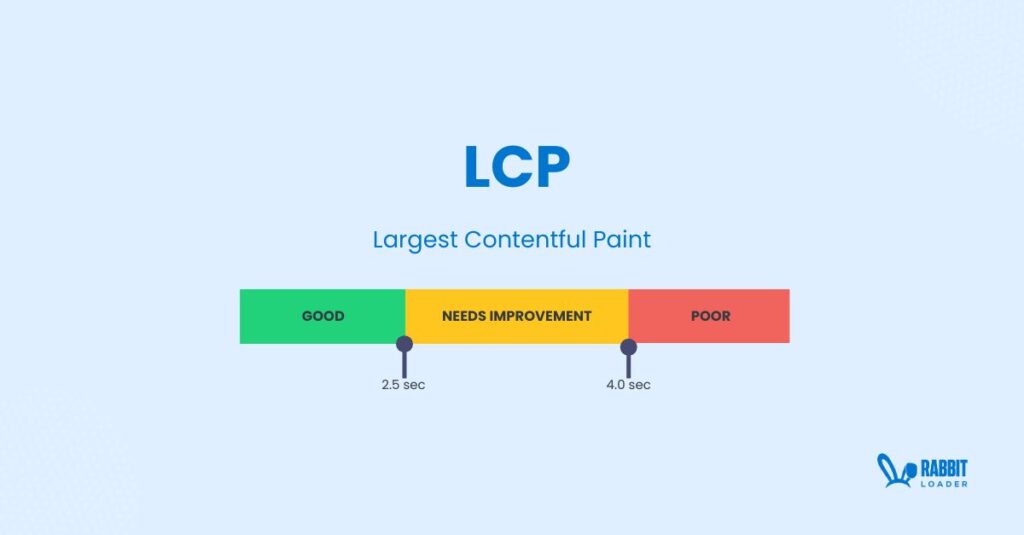
Usually for your home page it is the image in the hero section.
Benchmark: the ideal LCP for a website is just 2.5 seconds, if your website is taking longer than 2.5 seconds it should be looked into for optimization opportunities.
LCP has a 25% impact of the PageSpeed Insights, you need to have a good LCP to score over 90 on PageSpeed Insights and to pass the Core Web Vitals.
- Interaction to Next Paint (INP):
Interaction to the Next Paint measures the time it takes for a responsive element on your website to respond after it has been clicked or tapped in case of mobile users.
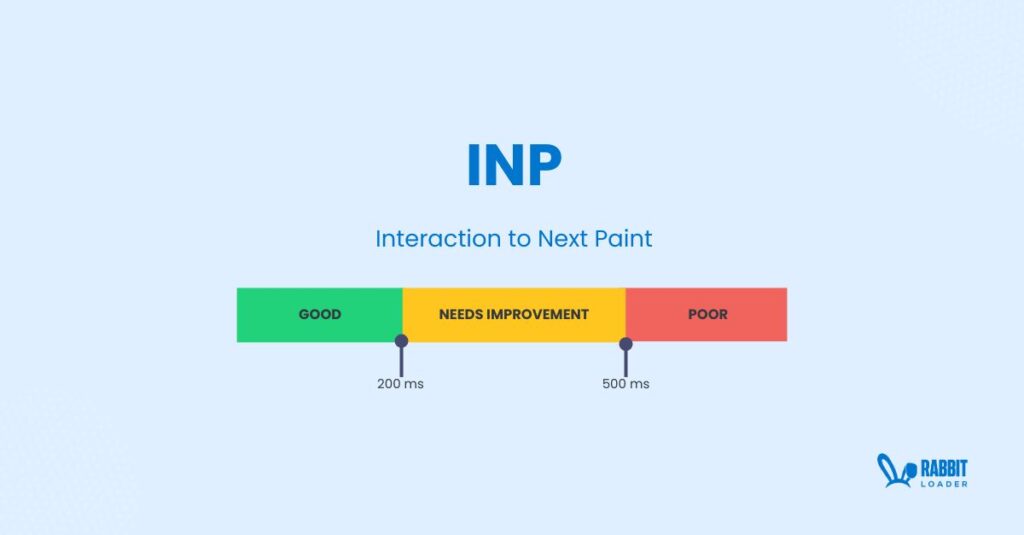
This click action may occur to a button on the page, a dropdown and any other element that interacts with the user input.
Benchmark: The ideal time to achieve for the INP is just 200 ms.
- Cumulative Layout Shift (CLS):
This is the only key web performance metric that is not dealing with time, in other words it is not measuring how fast your website can complete an action.
The CLS is the measure of how stable the visual elements on your website are.
Often when you load a website you would see the contents within the page for example a button, or image an image moves around while the page is loading or an advert appears and changes the layout of the page slightly.
These unwanted layout shifts are not good for user experience, google penalises your website in the Core Web Vitals if your website is not visually stable.

Benchmarks: The ideal value for the CLS should be within 0.1 for it to be considered as good.
Anything more than that signifies it needs improvements and if your CLS value is over 0.25 it is considered poor.
Since the CLS is not a measure of time, you might be interested to know how the CLS score is calculated. For that you can read our previous blog on how to measure CLS.
- Total Blocking Time (TBT):
The Total Blocking Time is the summation total time when the main thread is blocked.
To create or render a web page from code the browser has to complete a lot of tasks, like parsing HTML, CSS, JavaScript, compositing etc.
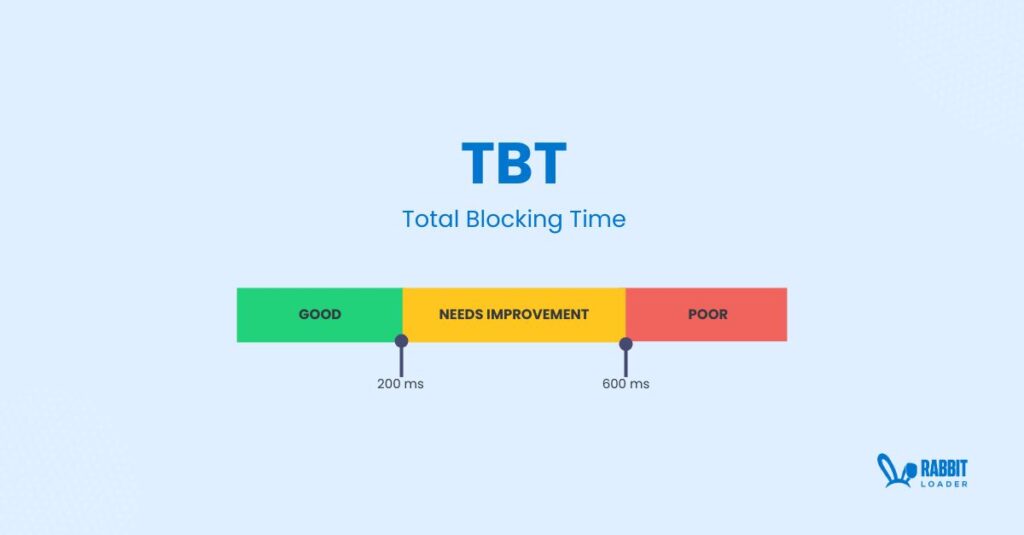
Most of these tasks are done in the main thread. Any tasks that take more than 50 ms of time are considered to be resource blocking tasks as it might cause an usability issue by making the page unresponsive to the user.
Benchmark: The benchmark for the TBT is 200 ms.
- Time to First Byte (TTFB):
The Time to First Byte measures the time it takes for the browser to receive the first byte of data.
When a visitor is opening a page on your website on a browser, the browser would send a request to your web hosting server, the server then would do its internal tasks & send that data back to the visitors browser.
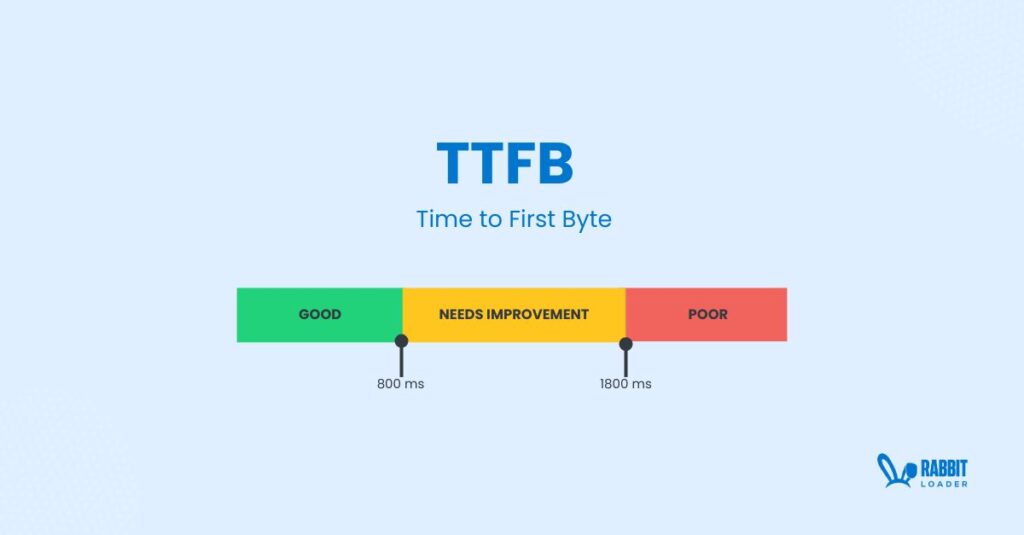
The time it takes from sending the request to receive the first byte of data is known as TBT.
Benchmark: To do well in PageSpeed Insight and Core Web Vitals the TTFB time your website should be within 800 ms.
- Time to Interactive (TTI):
Time to Interactive is the time it takes for your website to load completely & become interactive to user inputs.

Benchmark: Ideally it should take less than 3 seconds for your website to be interactive to be considered a high performing website.
Composite Metrics Website Performance Metrics.
While the above mentioned web performance metrics solely focus on measuring one indicator of website performance, some performance metrics combine more than one performance indicators to give concise yet impactful insight on the website performance, we can call them composite metrics.
- PageSpeed:
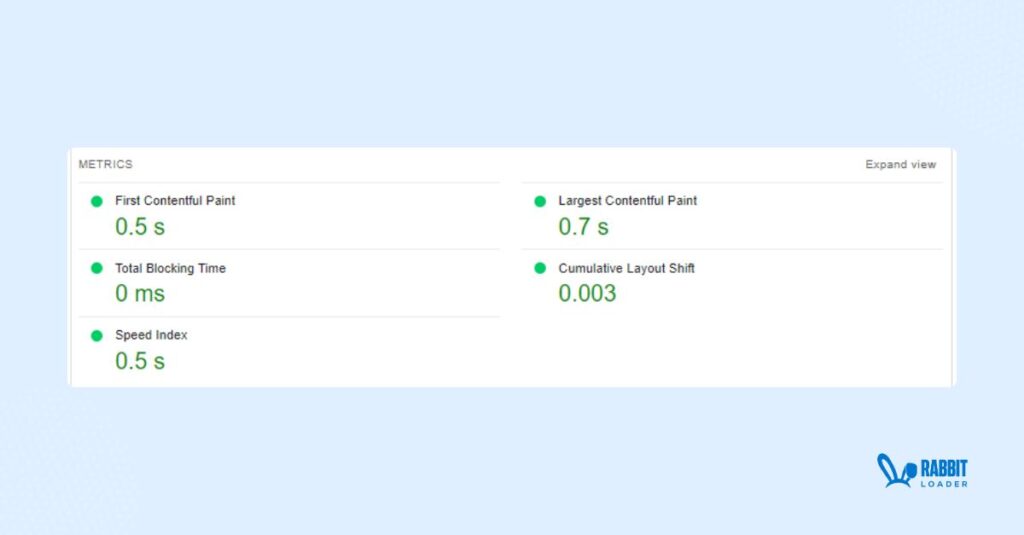
PageSpeed is the most important composite performance metrics, it gives you a score on the scale of 100 based on how your website is doing on below 6 performance metrics.
- FCP
- LCP
- TBT
- CLS
- SI
- TTFB
Benchmark: Ideally your webpages should score above 90 on PageSpeed Insights to be considered to have a good performance.
- Speed Index:
Speed Index measures speed of visual change on your webpage. It tracks the visual progress your page makes during the loading process.
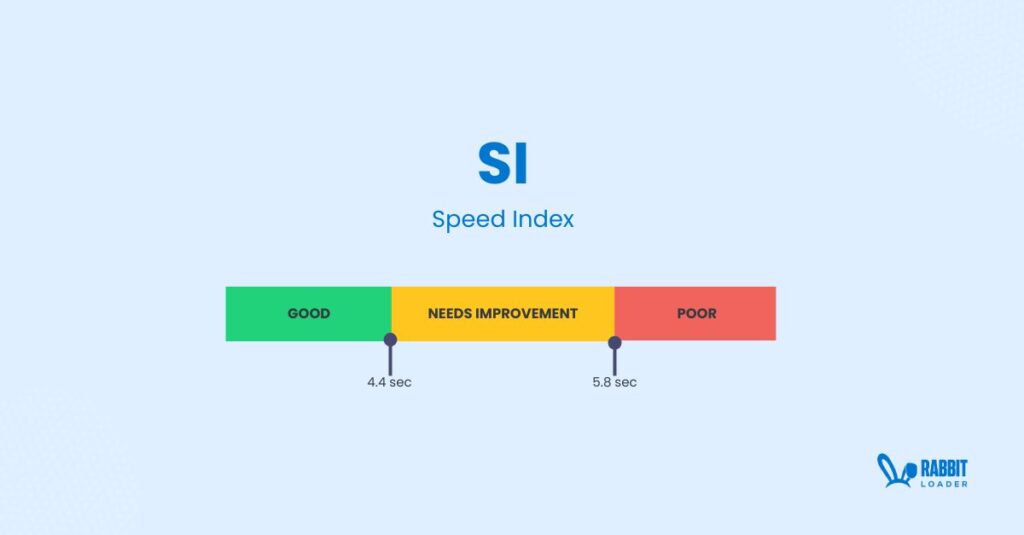
Benchmark: Ideally the visual area of your website should render within 3 Seconds, for it to have a good speed index.
- Core Web Vitals
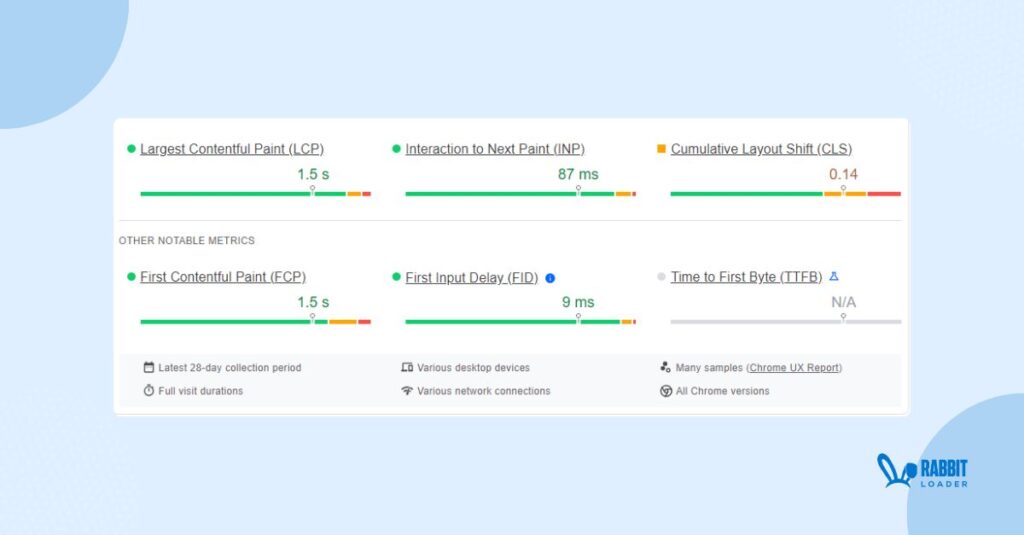
Core Web Vitals are the most important of the web performance metrics, it is not a composite performance indicator like the ones above. It consists of 3 independent performance metrics
- TBT
- CLS
- LCP
BenchMark: To pass the Core Web Vital tests you have to reach the benchmarks of all 3 performance metrics individually. We have mentioned the benchmarks above.
The Core Web Vitals are also a 28 day average of your website’s performance where the benchmarks must be true for at least 75% of your visitors.
Difference Between Performance Metric & “Key” Performance Metrics.
Notice how I mention “key” performance metrics in the last subheading instead of just performance metrics.
That’s because not all performance related metrics of your website have the same impact on your website’s perceived performance to the users, some are in fact more important than others.
Metrics such as DOM load time, connection time are also performance metrics of your website but they are not as important as others.
Lab Test Vs Real User Data
You might optimize your car for the best performance and it might even sound good, but the real test comes in when you take it to the road or a track, that is your real world performance & not just a few numbers on a piece of paper.
Get The Best PageSpeed Score
For Your WordPress Website
Similar to your car on a track, your website’s performance shows the real world user data when people visit your website, it has to load fast for the majority of your visitors out there, to be precise it has to pass the performance benchmarks for 75% of your visitors for you to pass the Core Web Vitals.
Web Performance Fundamentals
The goal of web performance fundamentals is to improve the Speed, visual stability and usability of your website.
Optimizing your website for below qualities would ensure you have a high performing website.
Speed
The goal of any performance optimization is to have a speedy website that has a very low loading time.
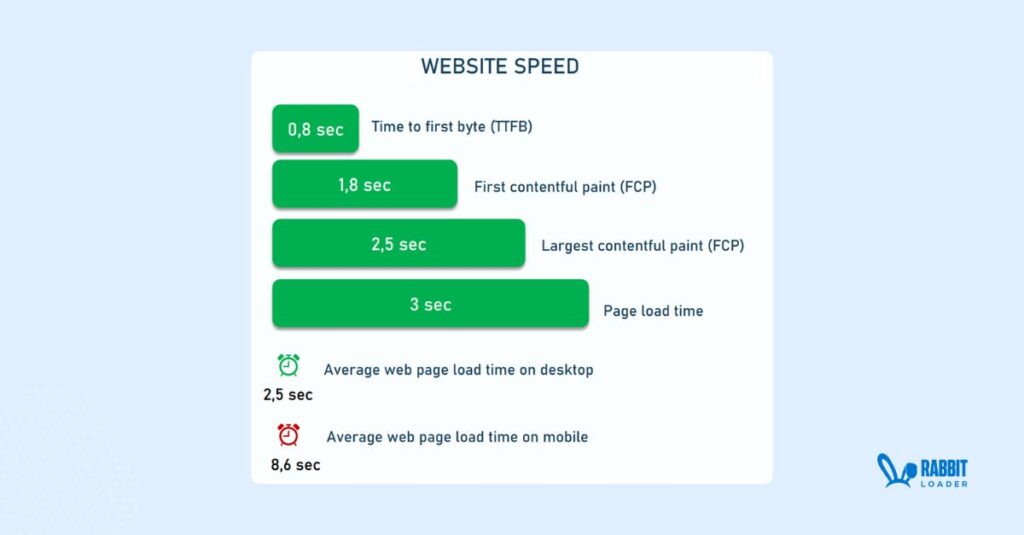
Solution: To achieve a fast loading website you would need to implement various optimization strategies to make the website page size smaller & prioritize what content would be loaded first.
Responsiveness
Your website should respond to user interaction immediately for a better user experience.
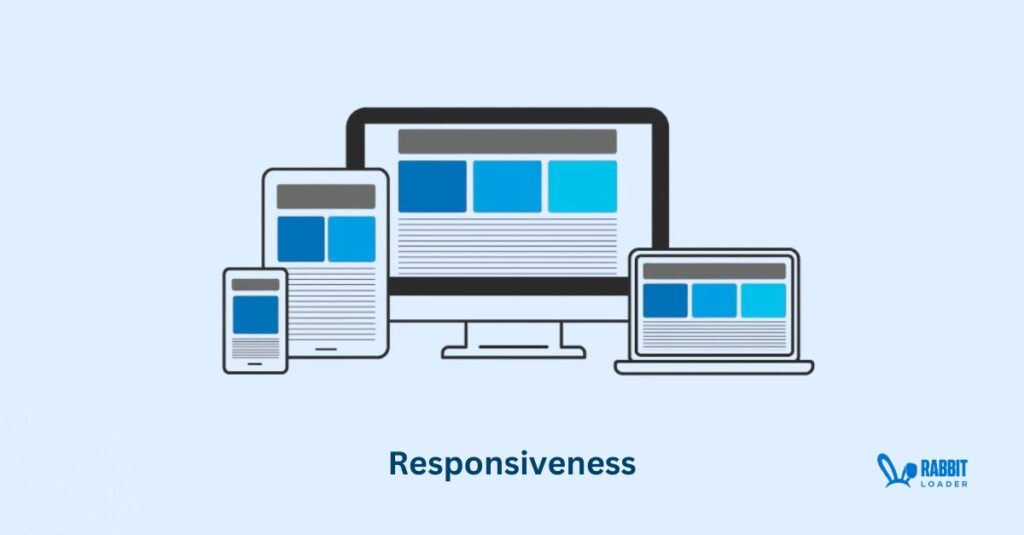
Solution: A responsive website can be achieved by deferring unnecessary JavaScript files and non-critical CSS files.
Visual Stability
A website’s visual integrity is crucial for performance and user experience — unstable layouts or shifting elements can frustrate users and damage trust. One key aspect of this trust is consistent branding, which starts with a clear, responsive logo design that renders cleanly on all screen sizes and devices.
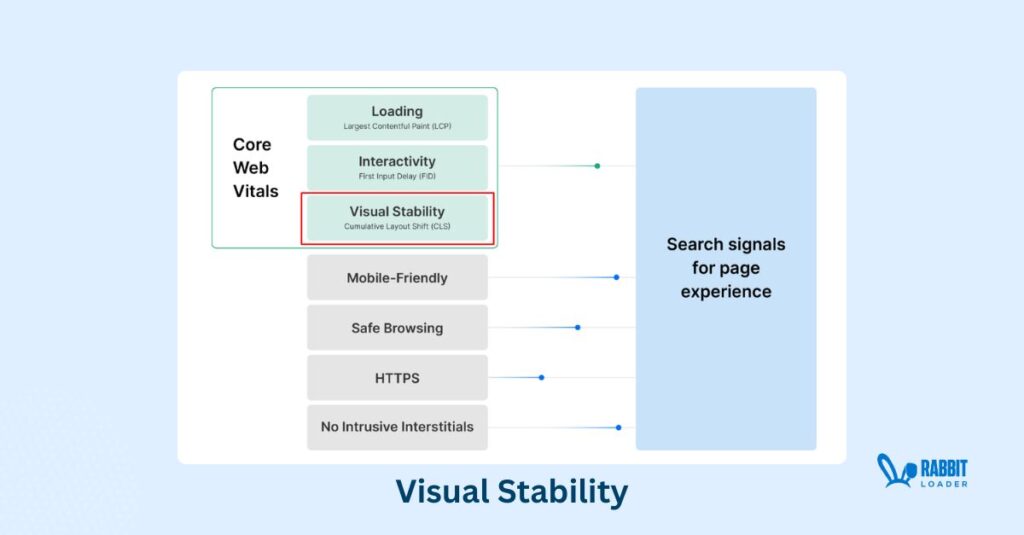
Solution: Achieving a visually stable website for different screen sizes is challenging, make sure to use explicit width attributes for images, and avoid dynamic content placement without reserving a space for it.
Resource Optimization
Your website resources like images, HTML, CSS & JavaScript files should be managed and optimized in order for your website to be fast without breaking the functionality or the visual appeal.
Solution: Optimizing the resources to reduce its size & deliver them quicker using a Content delivery network would result in better management of your resources.
Mobile Optimization
Most of your visitors would open your website on a mobile device, make sure your website is loading fast & visually satisfying your visitor on the mobile devices.
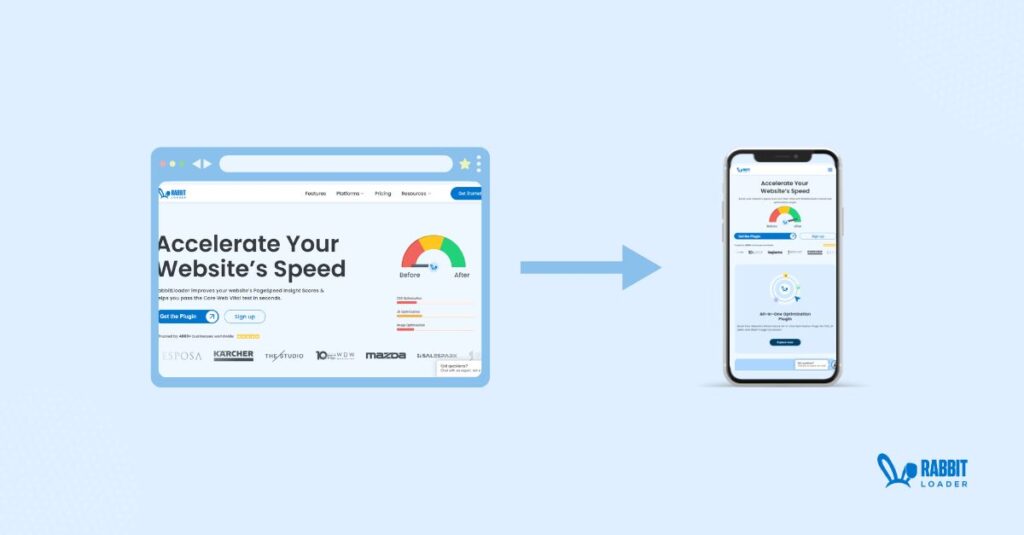
Solution: Using a responsive design & optimizing your static assets like images, JS, CSS for the mobile version of the website would make your website faster even for the mobile version.
Which Web Performance Measuring Tool To Use?
In order to improve the acceleration of your car you would need to know how good or bad it is in its current state and figure out what’s holding it back from achieving a faster top speed.
Likewise, if you need to improve the performance of your website, you would need to know which aspects of your website are slowing it down & if you have any room for improvements.
Get The Best PageSpeed Score
For Your WordPress Website
The two of the most trusted tools to measure the performance of your website are Gtmetrix and Google PageSpeed Insights.
These performance measuring tools not only find how long it takes for your website to load, they also help you get an insight on what is causing your website to load slow.
GTmetrix
Both Gtmetrix & Google PSI are very simple to use, just enter your website to run a test & they would produce the results in minutes.
Where these tools differ is basically how they score your website, most SEO’s and web developers find Gtmetrix to be easier to achieve a higher grade or score while Google PageSpeed test seems a bit stricter.
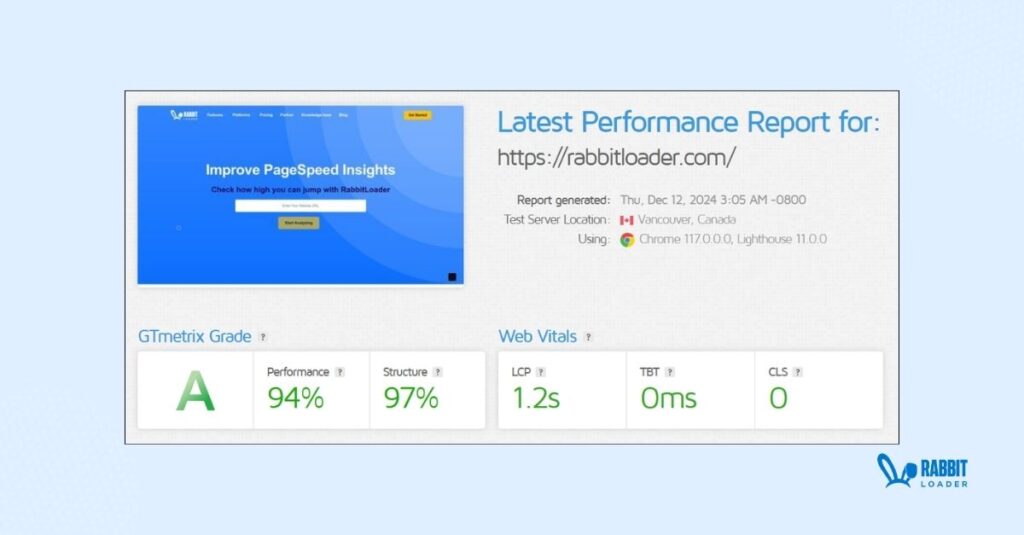
Another crucial part of evaluating these tools would be the pricing, which Google PageSpeed Insight is a free tool, Gtmetrix allows you to run only 1 test in a day.
But if you have a budget to spare, it helps you not only test the website’s speed but also monitor it for you. This could be helpful if you are optimizing your website and wish to check the impact of the optimization.
Google PageSpeed Insights
Apart from being a free solution to measure your website performance & to find out the scope of improvement, Google PSI has an unparalleled feature which comes from the power of Google’s ecosystem.
Although Google PSI can run lab tests similar to Gtmetrix. Google PSI can also show the results from actual users’ visits to your website using their chrome browser data.
It gives you a clear view on how your real visitors perceive your website performance to be, which is a much more important insight than the lab data.
To pass the Core Web Vitals test 75% of your visitors must pass the benchmarks for a period of 28 days.
So all your fundamental performance metrics like LCP, INP, CLS should be within their benchmark values individually for at least 75% of your visitors for the last 28 days in order for you to pass the Core Web Vitals.
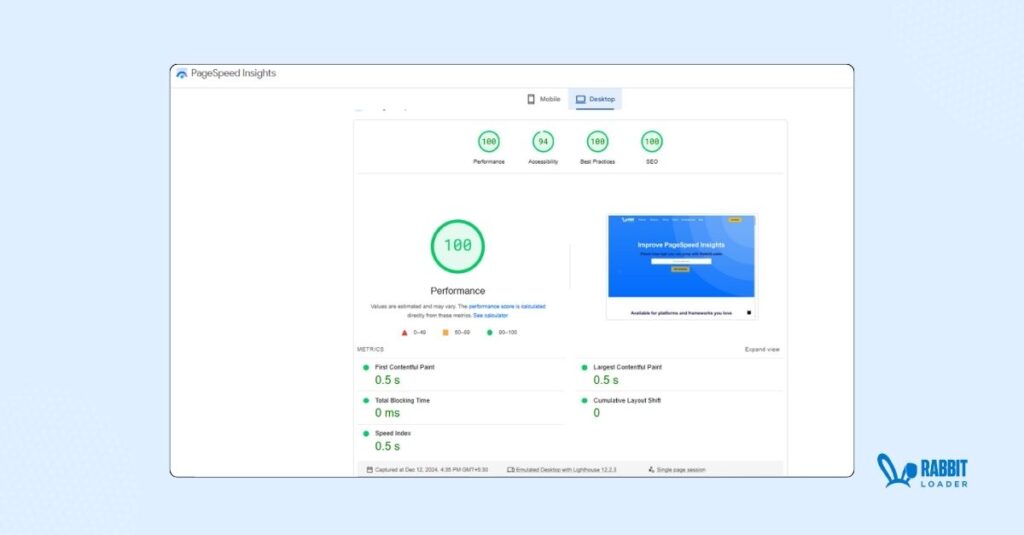
Because of Google’s proprietary data, we recommend you to use the PageSpeed Insights (PSI)
to measure your website’s performance.
Apart from these two hugely popular tools, pingdom is also often used to check performance of websites.
How Fast Should A Web Page Be?
A website should ideally load instantly when a visitor tries to open it, if your website is loading completely within 3 seconds that is a sign of a good website, anything more than that and you are looking at a higher bounce rate.
Get The Best PageSpeed Score
For Your WordPress Website
While huge websites with established brand identity can have the kind of brand value where the average user would wait for the webpages to load, for a lesser known website you must try to make it as fast as possible.
How To Improve Web Performance?
You can improve the web performance of your website by solving the underlying issues on your website. Each web performance metrics are impacted by how certain elements on your website are working.
Now you have seen there are a lot of web performance related metrics, but the good news is they are very connected and solving one underlying issue would have a positive impact on multiple web performance metrics.
Below we have mentioned 7 optimization techniques you can implement to optimize your website for better web performance.
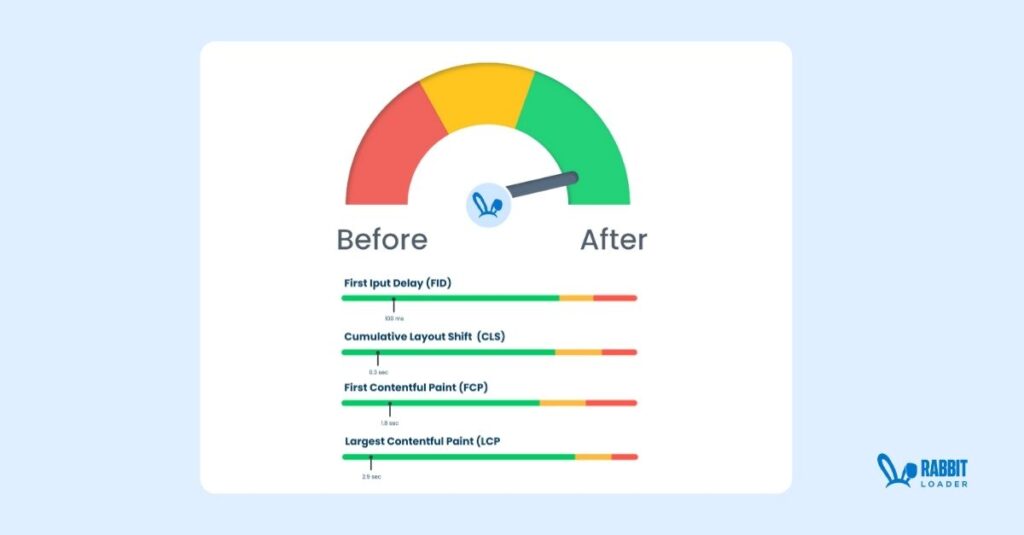
These techniques can be implemented by coding or using third party tools.
We recommend you to use RabbitLoader if your CMS supports it, as RabbitLoader would implement all those optimization techniques in just a few minutes on your website with just a few clicks depending on if RabbitLoader supports the CMS.
If you are on WordPress, the RabbitLoader plugin can be installed in just 2 clicks and this would optimize your website instantly.
The changes would be visible immediately & you can measure the difference in performance on PageSpeed Insights.
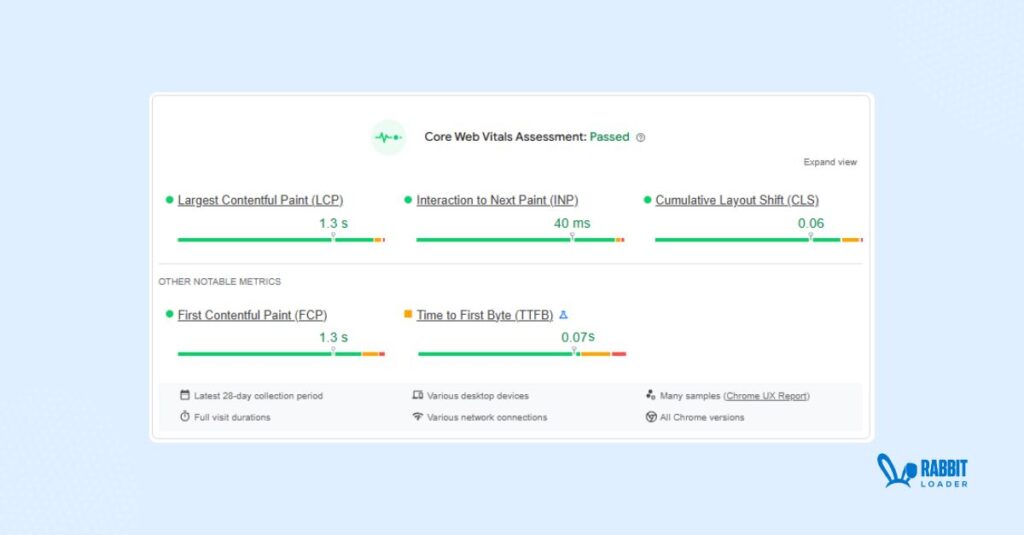
You can do the same if you are on Shopify & WooCommerce. For platforms like Laravel and PHP there’s RabbitLoader SDK to implement theme optimizations.
But if you are working with other platforms, I suggest you go through the list techniques and try to implement them on your website to improve your website’s performance metrics.
7 Web Performance Metrics Optimization Techniques.
Image Optimization
Image Optimization is probably the most used optimization technique when it comes to improving the performance of your website.

There is a long list of plugins & tools that deals specifically with optimizing images to reduce its size.
- Impacted on Performance Metrics:
Image optimization can majorly improve LCP, CLS & FCP.
- Key points to keep in mind with image optimization:
When optimizing the images using a tool make sure your images are compressed losslessly, so you do not lose the quality of your images, trying to make it a bit smaller.
Lazy Loading
Imagine you have an internet bandwidth that allows 2 MB per second of data to be downloaded on your browser, and you are trying to open a webpage with a size of 10 MB, it’s gonna take 5 seconds.
As a web developer or website owner you cannot increase the bandwidth on your visitors internet connection but you can prioritize your content loading to dictate what you are gonna load in your users browser first.

Well in web performance this is where Lazy Loading comes into play. LazyLoading prioritizes content to make sure contents that are visible to the users initially are loaded with priority and the rest of the off screen or below the fold content is loaded later when needed, hence the name Lazy loading.
- Impacted on Performance Metrics:
Lazy loading can majorly improve LCP & CLS.
- Key points to keep in mind with Lazy Loading:
Make sure that your lazy loading toll, plugin or code is not lazy loading your hero section images or the background image on your viewport.
This would make the images load very slowly, which in turn would bump up your LCP timing hugely and drag your PageSpeed Insight scores and user experience down.
Browser Caching
Some static assets that do not change very often, for example the logo of your website are usually saved in the user’s browser memory using the browser caching technique when the visitor first opens any page on your website.
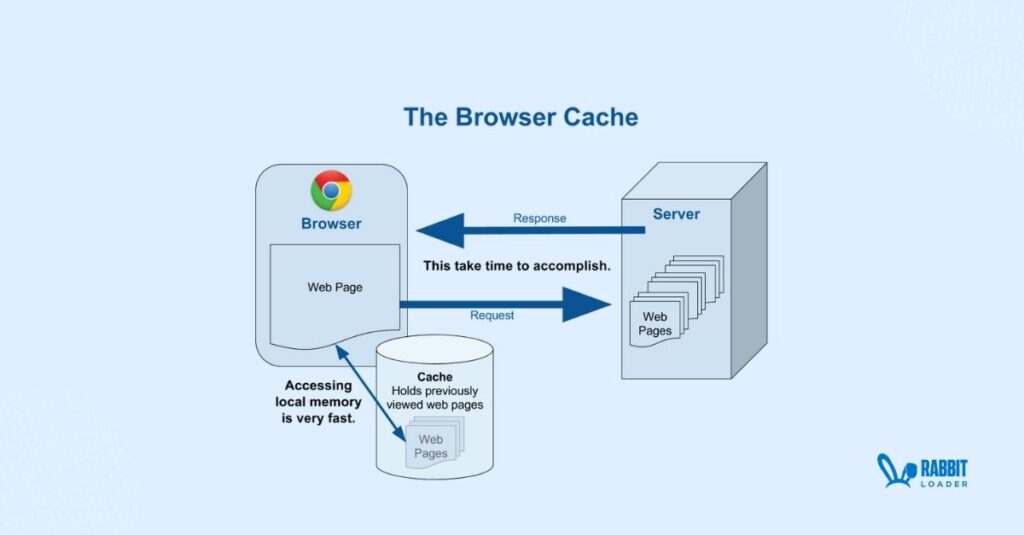
When the visitor opens another page on your website the logo and other shared assets are loaded from the user’s browser instead of your hosting server, this saves time and delivers a much faster browsing experience to the visitors.
The browser caching is also effective for returning users.
- Performance Metrics Impacted:
Implementing browser caching can hugely improve Time to First Byte (TTFB).
- Key points to keep in mind with Browser Caching:
Make sure the tool or the program you are using for browser caching is tested with your tech stack, so the cache invalidation works flawlessly.
When you update your cache content, the browser mache mechanism should be able to purge all the old content. Otherwise you risk showing the user stale or old content.
Content Delivery Network
A Content Delivery Network works similar to a browser cache but it works at the server level.
Instead of saving the regularly used contents like images, CSS, JavaScript codes in the users browser, a copy of these are saved on different servers around the world, known as edge servers.
When a visitor tries to open your website, in the presence of a CDN network the browser would get the contents from the nearest edge server instead of your hosting provider.

A CDN reduces the loading time of your website, no matter where in the world your visitor is.
- Performance Metrics Impacted:
CDN has a huge impact on TTFB & TBT times, these could be lowered significantly using a Content Delivery Network.
- Key points to keep in mind with Browser Caching:
Before adding a CDN network to your website, please check the available Points of Presence (PoPs) for the CDN.
More PoPs indicates better coverage for your visitors from around the world. You can check how good a CDN service is by checking a website that is using the same CDN service on pingdom.com.
You would be able to see how long it takes to load the website from different parts of the world, and decide if the CDN service is right for you.
Minification
The Codes that make up your website are written by a human, and we humans need line breaks & spaces to make sense of codes,it’s similar to how we process written words.
A page full of words without line breaks and spaces won’t be readable to us, but a browser won’t need those extra spaces to render your website, that is to paint the picture of your website from the codes in it.
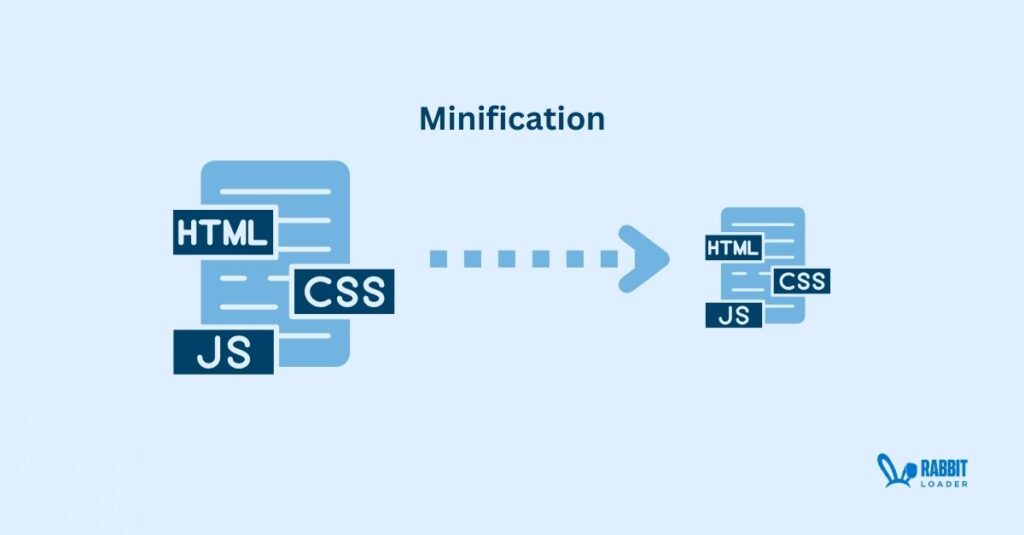
Hence removing those spaces would reduce the size of your webpages a little lighter and it would make your website load quicker. This process of reducing code size is called minification.
- Performance Metrics Impacted:
Minification has a minor impact on TBT & TTI performance metrics.
- Key points to keep in mind with minification:
Although minification won’t make your website a lot fatter, it can reduce the code file sizes by 20-30% on an average and it is worth trying when it comes to optimizing performance of your website.
JavaScript Deferring
JavaScripts are resource intensive, meaning the web browser has to do a lot of work in order to do what the JavaScript file tells the browser to do.
This makes the loading of your website slower if you have a lot of JavaScripts on your webpages.
But, similar to the lazy loading concept, we can prioritize the scripts that need to be parsed immediately and the scripts whose execution could be delayed.
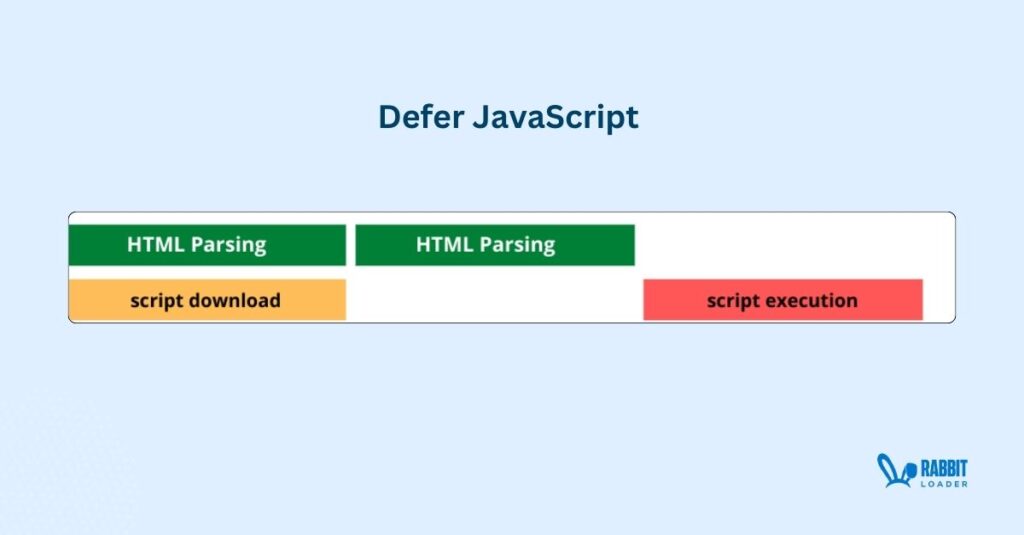
This delayed execution of non-critical JavaScript makes the website load faster, and the process is known as JavaScript deferring.
- Performance Metrics Impacted:
JavaScript deferring can help reduce the time for the TBT & TTI performance metrics, it is especially important for mobile versions of the website.
- Key points to keep in mind with JavaScript deferring:
When deferring JavaScript make sure not to defer any critical JavaScripts, this might turn your website visually or functionally broken.
Critical CSS Generation
CSS adds the aesthetics on your website & modern designs do have a lot of CSS files, Although the CSS files are necessary for your website to look good, not all of them are needed immediately when the page is loading.
Only the CSS of visible areas on screen, also known as critical areas, needs to be loaded immediately.
Critical CSS generation is the process of creating a separate CSS file with scripts impacting the critical area.
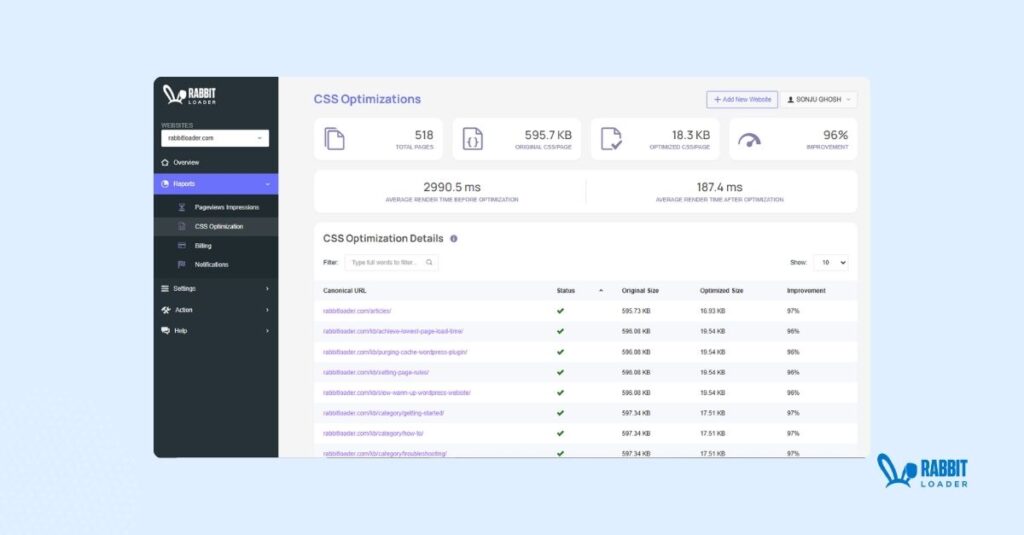
This Critical CSS is loaded before any other CSS files, to deliver a lightning fast website.
- Performance Metrics Impacted:
Critical CSS can improve FCP, LCP, and TTI hugely.
- Key points to keep in mind with Critical CSS:
Critical Css can really impact the score on your PageSpeed test & Core Web Vitals, it could well be the difference between passing the Core Web Vitals tests or failing it as critical CSS by itself can add 15 to 20 points to your PageSpeed score.
Web Performance Course
Website performance improvement can be done easily with tools and plugins similar to RabbitLoader.
Especially if you are on a self hosted website and on a CMS like WordPress.
It is easier to optimize your website’s performance with tools & plugins, but if you are working on other platforms.
CMS or custom development environment web performance where optimization tools are hard to come by, learning optimizing your web performance might be necessary for you.
Get The Best PageSpeed Score
For Your WordPress Website
Here we have created a list of web performance courses you are following in order to learn optimizing the performance of websites.
- Web Performance Course by HubSpot
- Udemy Web Performance Course
- Udacity Web Performance Course
- Free Linkedin Web Performance Course
- Web Performance Course by Frontend Masters
Web Performance Monitoring After The Improvement
Web performance monitoring is probably as important as checking keywords rankings for a SEO, but performance monitoring could be costly, to save you time we have listed 3 of the most trusted website performance monitoring tools.
These tools would help you keep track of your website speed and help you with suggestions to improve it.
RabbitLoader:
Among the website performance monitoring tools, RabbitLoader is hands down the best choice if you are on WordPress, WooCommerce, Shopify, Php or Laravel.
RabbitLoader doesn’t only improve the speed of all your webpage by implementing various optimization techniques. It also helps you monitor the performance of your web pages.
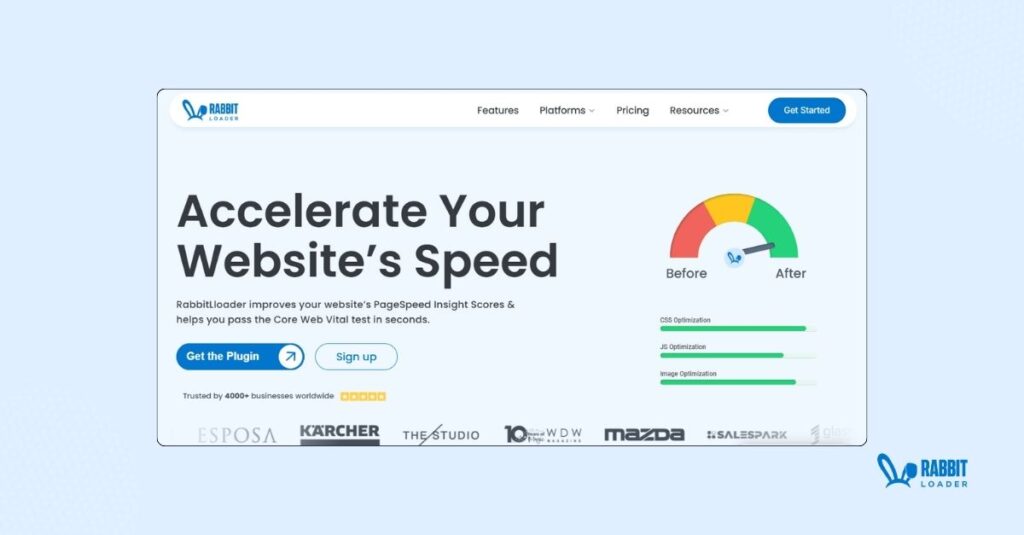
You would be able to check out the PageSpeed score of all your pages right on the RabbitLoader plugin itself and it is available for both the desktop and the mobile version of your web pages.
RabbitLoader Pricing:
RabbitLoader is a freemium performance optimization plugin for WordPress, if your website is not very big and you are not currently generating a lot of traffic, the free plan should suit you very well.
If you are currently entertaining a sizable number of visitors the paid plans for RabbitLoader starts from $15.
Debugbear:
Debugbear is a relatively lesser known solution to the performance monitoring and it is more suited towards development teams than casual users.
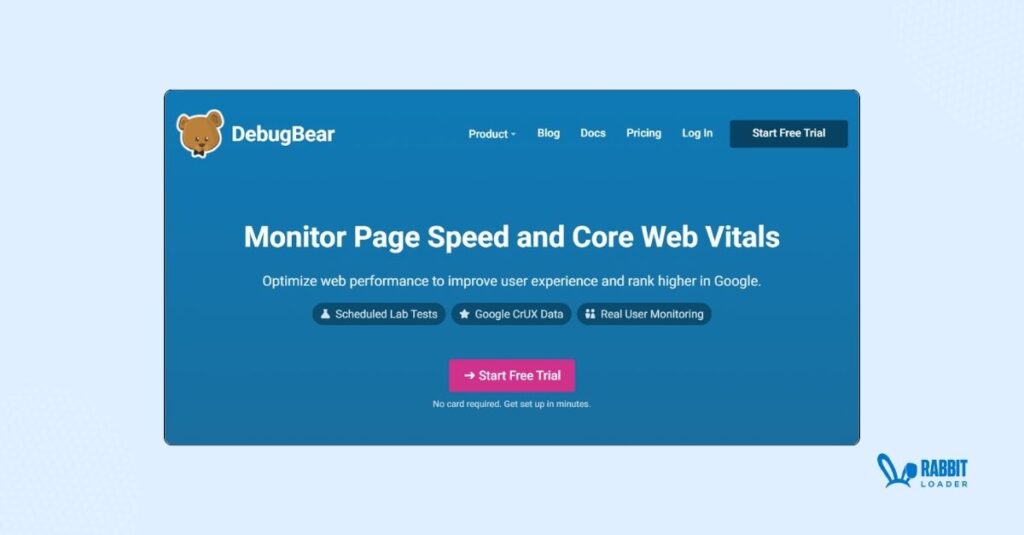
It allows continuous monitoring and in-depth analysis of performance issues.
Debugbear pricing:
Debugbear subscription starts from $39.And it allows you a higher volume of tests when compared to Gtmetrix.
Gtmetrix:
Among the performance monitoring tools Gtmetrix is much more user friendly as it is more suited to a regular user.
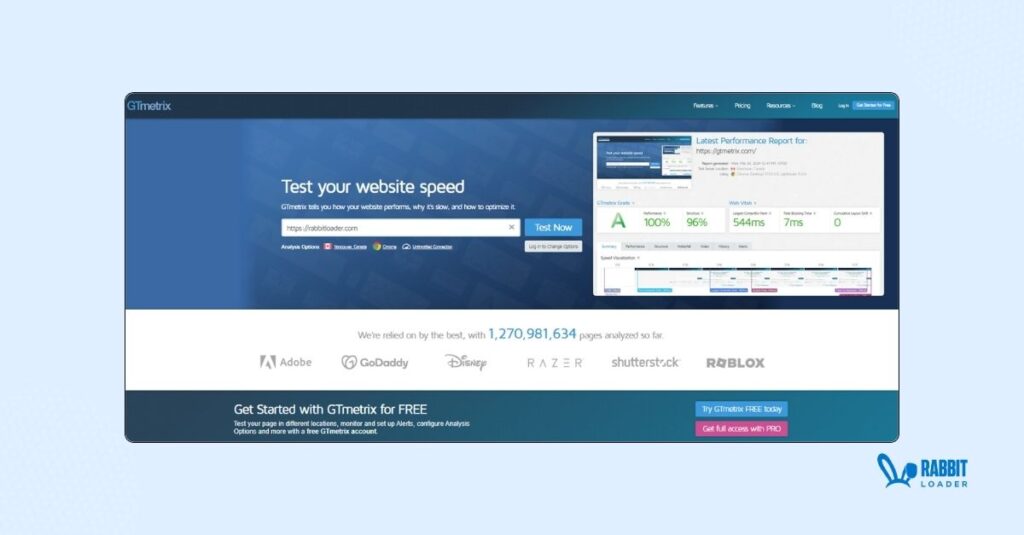
You do not need to be a developer to implement it. It is also quite well known among the two paid options in this list.
Gtmetrix Pricing:
The free plan of Gtmetrix only allows you 1 test a day. The automated monitoring and scheduled tests start from just $5 but it also doesn’t allow too many tests.
FAQ
The best image formats for web performance are next-gen image formats like WebP & AVIP.
Both the formats were developed exclusively for the web, they take up a fraction of the space compared to legacy formats like PNG & JPEG without losing the quality of the image.
We performance can be checked online on these websites:
https://pagespeed.web.dev/
https://gtmetrix.com/
https://www.webpagetest.org
These optimizations would not only improve the speed of your website, it would improve the overall performance of your website.
Making your car faster & improving ride quality might take a lot of work but improving your website performance can be done instantly with just a few clicks using the RabbitLoader.