Get The Best PageSpeed Score
For Your WordPress Website
All in One Optimization Plugin
No Coding Knowledge Required

GTmetrix is a popular tool for analyzing your website’s pagespeed performance. Google considers pagespeed as an important ranking factor in its algorithm. Thus, every website owner should measure and improve pagespeed of their website.
Here GTmetrix comes into play to analyze your website’s pagespeed score and improve on the current performance.
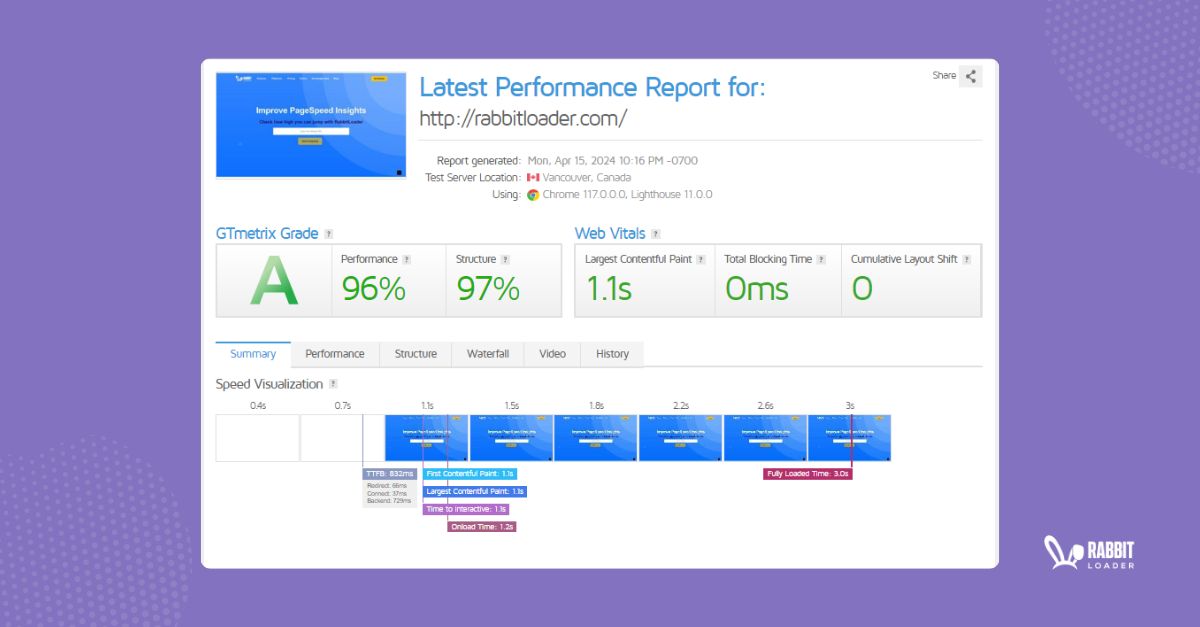
GTmetrix is an independent performance testing & monitoring tool that analyzes your website’s pagespeed performance and scores on a scale of 0 to 100 as a percentage and also grades them from A to F based on the performance score and structure score. You also explore the web vitals performance of your website in GTmetrix.
Get The Best PageSpeed Score
For Your WordPress Website
Let’s see the weightage of the performance score and structure score in the GTmetrix grade.
You can customize the GTmetrix testing based on test location, browser, network connection, and others.

To analyze the performance of your website in GTmetrix, you need to go through the following steps.
Step 1: After opening GTmetrix in your browser, enter your website’s URL and click on Analyze for your website speed test.

Step 2: After waiting for some time, you can see your website’s and Web Vital’s performance scores.
Below we will interpret the result in detail.
Gtmetrix score is based on the site speed performance:
Let’s see the general guide for the GTmetrix grade based on the performance score.
| Score in percentage | Grade | Color |
| 90-100 | A | Green |
| 80-89 | B | Light Green |
| 70-79 | C | Yellow |
| 60-69 | D | Orange |
| 50-59 | E | Dark Orange |
| 0-49 | F | Red |
GTmetrix is the best alternative to Google Pagespeed Insights. While both tools analyze your website’s page load speed, they have some key differences.
| Google Pagespeed Insights | GTmetrix | |
| Stability | Every time you check the pagespeed score in Google PSI, it would be slightly different. | GTmetrix’s score is more stable than Google Pagespeed Insights. |
| Test Location selection | In Google Pagespeed Insights you can’t select any test location. | In Gtmetrix you can customize the testing by specifying the test location. |
| Waterfall analysis | There is no waterfall chart you can see in Google PSI. | GTmetrix shows you a waterfall chart. Help you understand which content was loaded in which order. |
| Network Connection | Google PSI works on simulated throttling. Here, desktop and mobile tests are done separately at different network speeds. | An unthrottled connection is used in GTmetrix by default. But based on your demands, you can switch the network connection. |
| Test with different Browser | In the case of Google PageSpeed Insights, headless/ emulated browsers (browsers without user interface) are used. | GTmetric uses a real browser (Google Chrome) to load your webpage. |
You can see a lot of things that could be overwhelming, this guide would make it easier for you to understand different parts.
The summary tab provides a complete snapshot of your web page’s performance and structure.
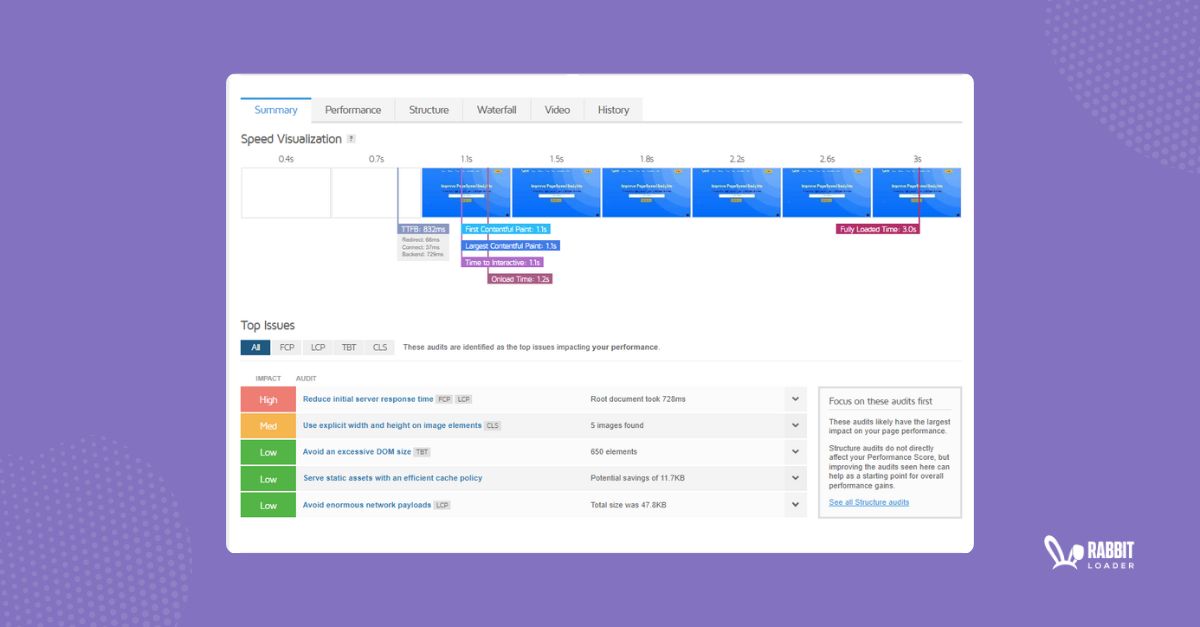
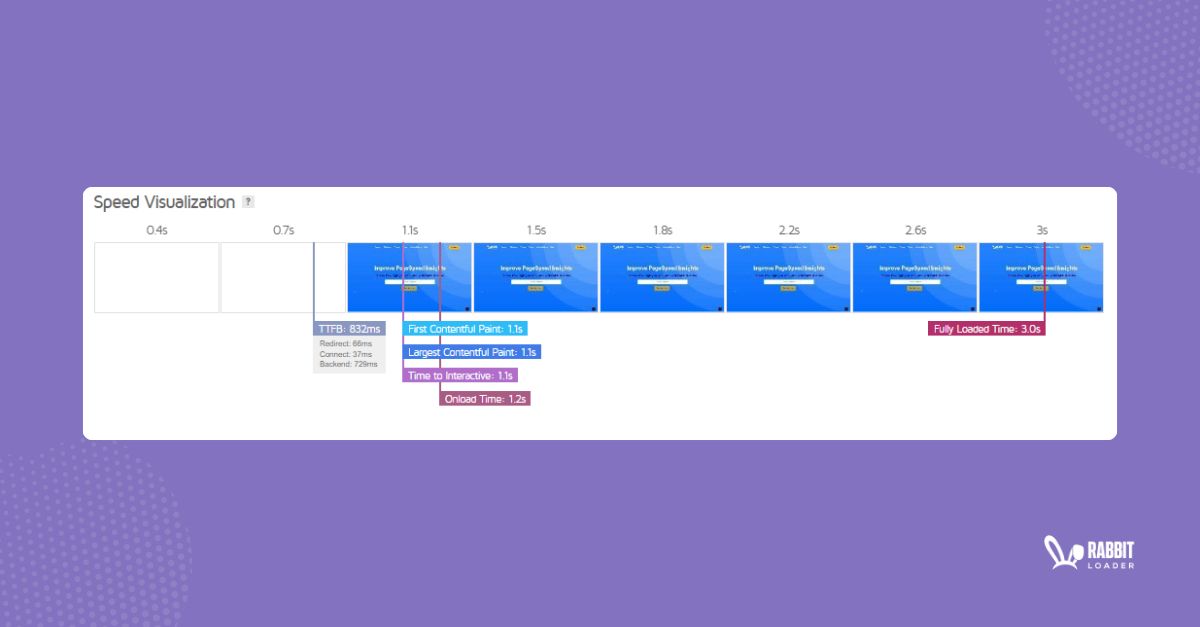
At the top of this summary tab, you can see speed visualization. Here, you can analyze when certain performance metrics such as First Contentful Paint (FCP), Time to First Byte(TTFB), Time to Interact (TTI), Onload Time, and Fully Loaded Time come into play & their time stamps. Hence you can very easily figure out the issues.
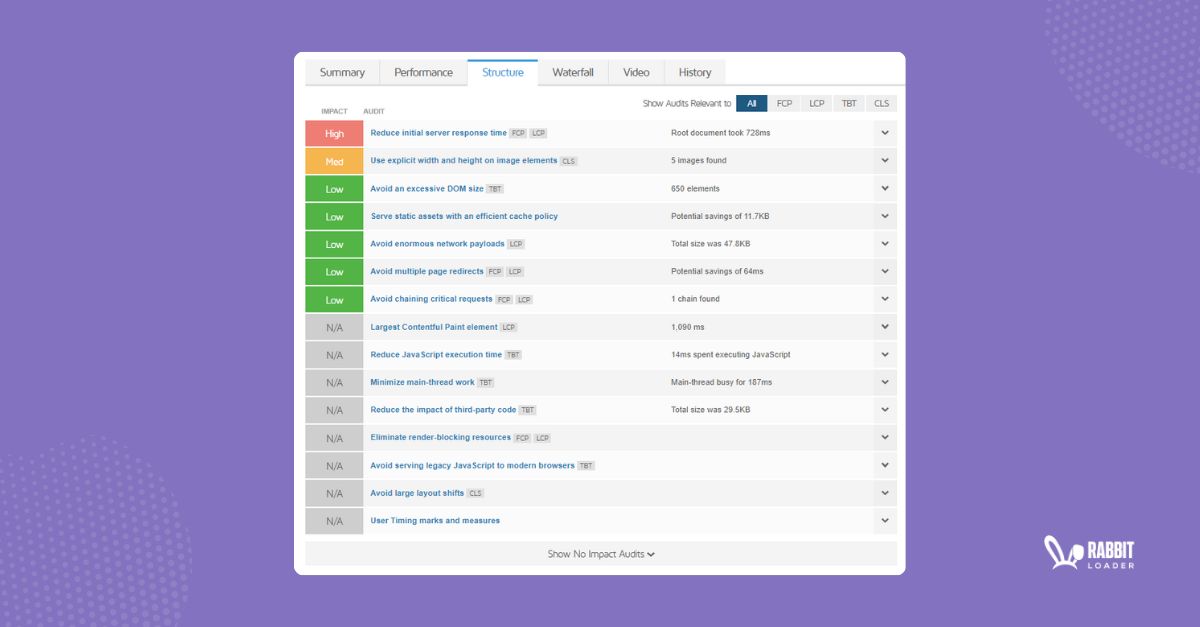
Below the visualization section, you will see the Top Issues that actually tell you what you should do to improve your website’s performance. These issues impact your website performance, such as Reducing initial server response time, Avoiding an excessive DOM size, and many more.

Using RabbitLoader, you can solve these issues without installing any further optimization tools. RabbitLoader has inbuilt strategies to mitigate each suggestion that you can see in GTmetrix. Let’s understand with an example.
As you can see in the above images, the first suggestion is to Reduce the initial server response time. This can be mitigated by implementing a Content Delivery Network (CDN), which is available on RabbitLoader. Also, by compressing HTML files, RabbitLoader can Avoid Excessive DOM Size.
You can also use RabbitLoader on your WordPress site, Shopify, PHP, or, Laravel website.
In the performance tab, you can see the two sections:
Performance metrics are used to analyze your website’s performance such as loading speed, functionality, and user experience (UX). These performance metrics include:
Get The Best PageSpeed Score
For Your WordPress Website

Depending on the performance you can see different colors and statuses.
| Color | statuses |
| Green | Good – Nothing to do here |
| Light green | Ok, but consider the improvement |
| Orange | Longer than recommended |
| Red | Much longer than recommended |
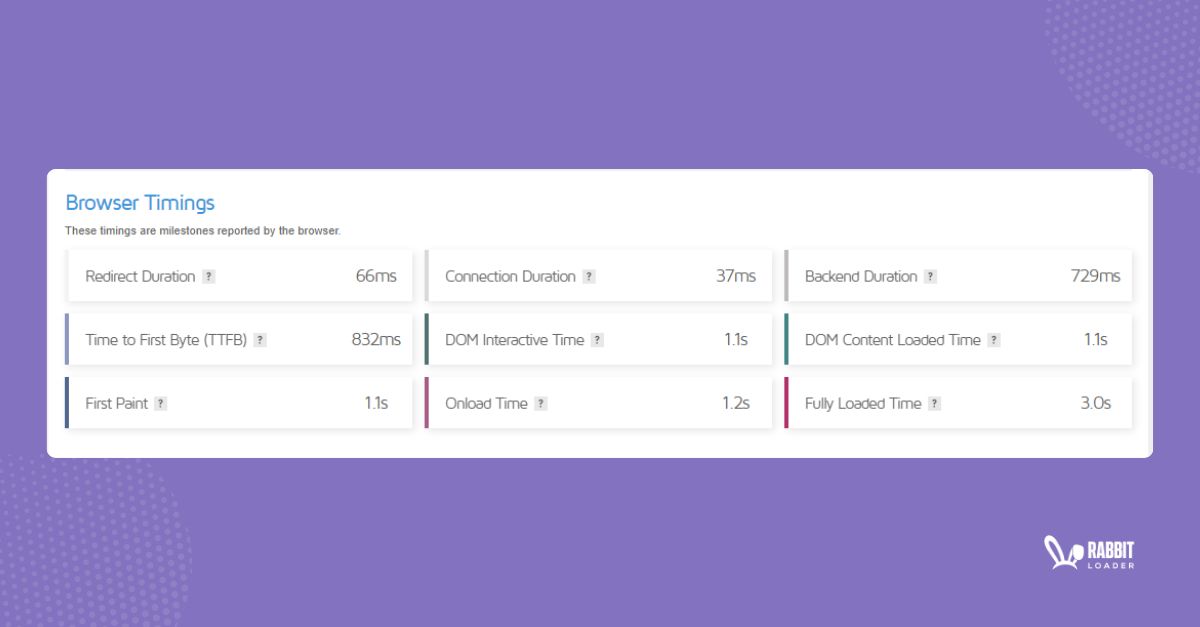
Browser timings represent the different milestones that are reported by the browser. Previously these timings were present in the Timings Tab in GTmetrix with Pagespeed/ YSlow score. These browser timings involve:
Check Also: PageSpeed Optimization Services
In the structure section, you can see how much a particular audit affects your pagespeed performance score. Based on the priority, GTmetrix will show you the color code and impact.
| Color | Remarks | GTmetrix pro tips |
| Red | High | Improving this audit can substantially increase your website performance. |
| Orange | Medium | Improving this audit can moderately increase your website performance. |
| Green | Low | No improvement is necessary. |
In the waterfall chart, you can see the loading of the elements in their loading order, along with the duration and execution time of requests. There are 5 columns present in this chart:

Hovering on the Timeline for each content will open a new pop-up where you can see the different phases of the content’s loading process.

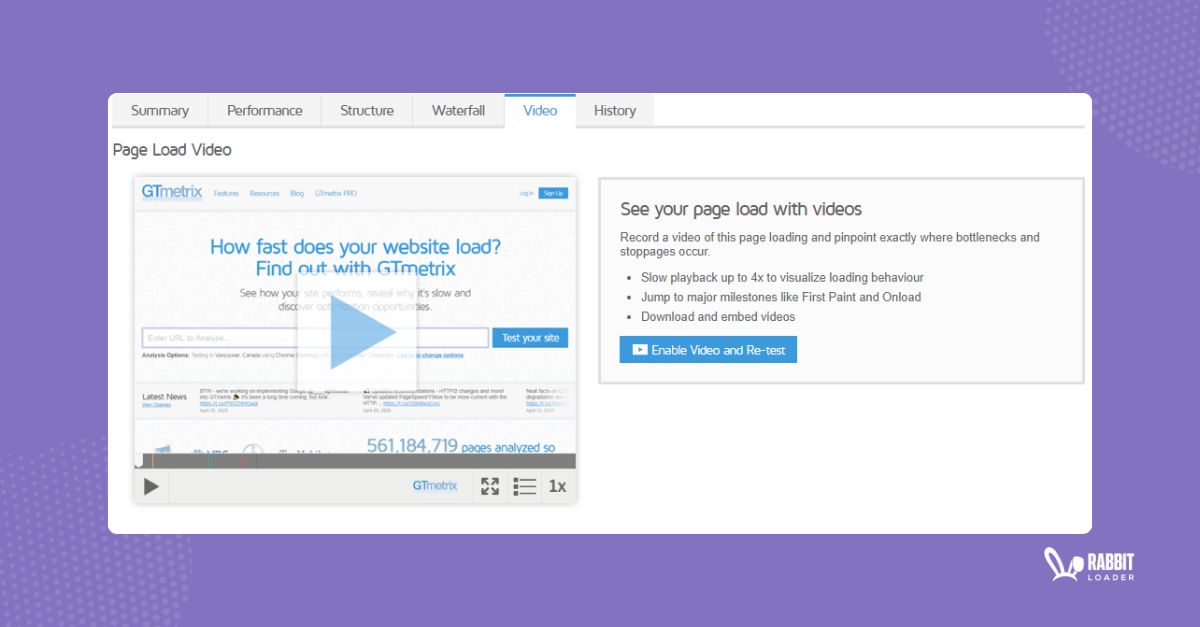
By clicking on Enable Video and Re-test, you can record the video of your web page loading in other browsers and analyze and detect any visual issues like flickering.
Once you retest your webpage, you can view GTmetrix report data with different graphs to monitor its page speed performance.
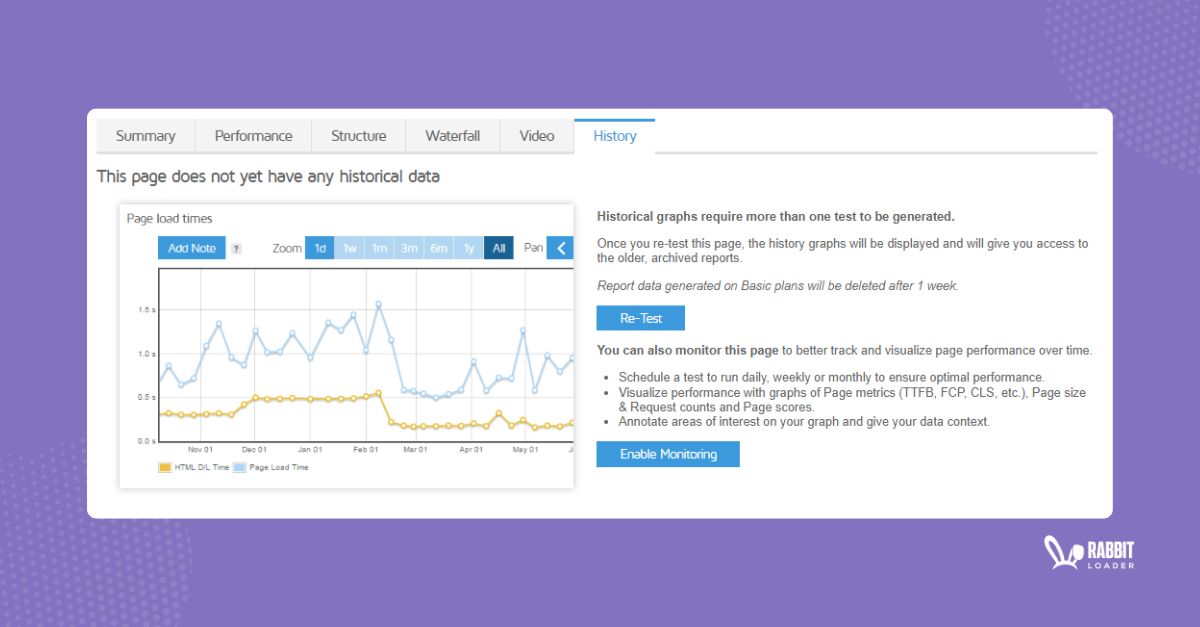
For a better understanding of the History, you need to analyze your website before using RabbitLoader. After implementing the GTmetrix suggestion by using RabbitLoader, you need to retest your website. Then, you can see the improvement of your website.
Get The Best PageSpeed Score
For Your WordPress Website