Get The Best PageSpeed Score
For Your WordPress Website

The 3 Most Powerful Ways to Boost Speed Index in Pagespeed Insights and Enhance Your User Experience
Speed Index (SI) is one of the key performance metrics that Google PageSpeed Insights and Lighthouse consider to grade your website. If you are doing poorly in Pagespeed Score, SI is one of the reasons.

You don’t need to worry! Many website owners are struggling with this poor speed index score. Let’s discuss the 3 most powerful strategies to boost the speed index for enhancing your user experience.
What is the Speed Index?
Speed Index (SI) is a known performance metric that is used to measure how quickly the contents of your web page are rendered. Several factors can affect your Speed Index metric:
- Server response time
- File size and compression
- Browser rendering
- Render blocking resources

In simple words, The speed index takes the visual progress of your visible web page loading and calculates the overall score for how quickly your content is rendered.
Speed Index Effects on Your Website’s Performance Score
Google Pagespeed Insights, GTmetrix, and Google Lighthouse score the overall performance based on the real user’s performance metrics experience such as:
- First Contentful Paint
- Cumulative Layout Shifts
- Largest Contentful Paint
- Speed Index
- Total Blocking Time.

Here, we are discussing the weightage of these performance metrics.
| Performance metrics | Weightage (in percentage) |
| First Contentful Paint (FCP) | 10 |
| Speed Index (SI) | 10 |
| Largest Contentful Paint (LCP) | 25 |
| Total Blocking Time (TBT) | 30 |
| Cumulative Layout Shift (CLS) | 25 |
How to Measure Speed Index
One of the top tools for measuring Speed Index is Google Pagespeed Insights (PSI). This Google PSI score is based on lab data as well as field data. To measure the SI score in Google PSI you need to follow the below steps:
Step 1: Open Google PageSpeed Insights in your browser. After entering any web page’s URL click on Analyze.

Step 2: After auditing your web page’s pagespeed performance, It will provide a SI score for both, the mobile version as well as the desktop version based on the overall performance of the core web vital metrics and provide a score on a scale of 0-10.

Step 3: Google PSI also gives you suggestions for improvement of your website’s pagespeed performance.

There are various alternative tools available that you can use to measure the SI score: GT metrics, Lighthouse, and others.
What is a good Speed Index?
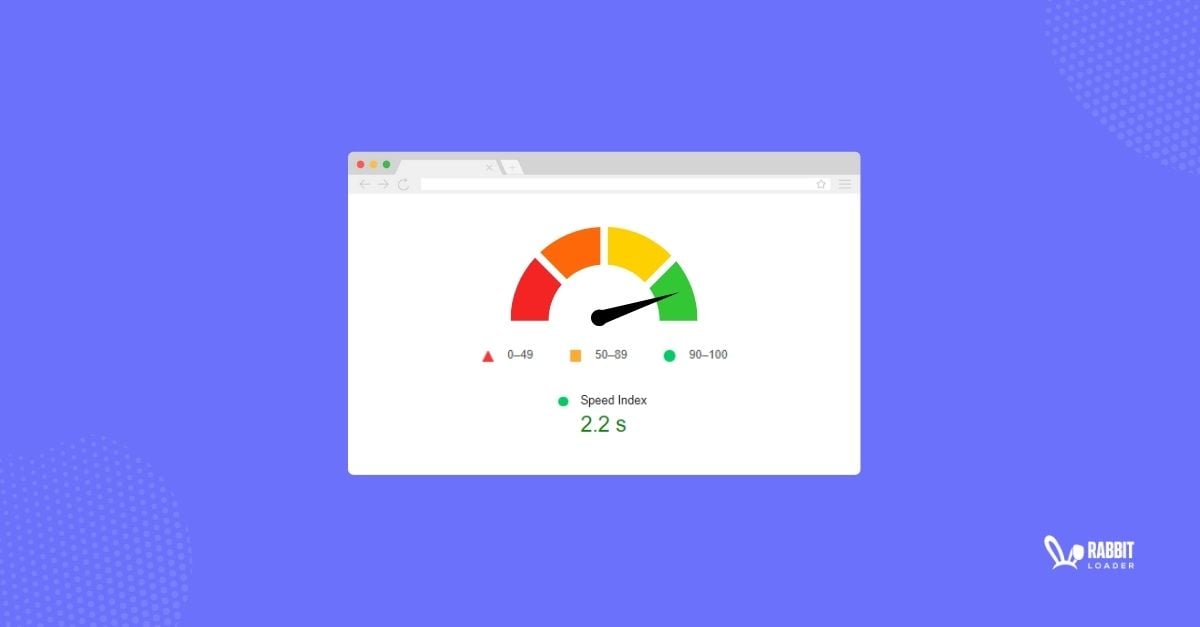
Like the other web vitals metrics such as FCP, TBT, LCP, and CLS, SI also has threshold values. If the speed Index score is less than 3.4, it is considered as a good score.
| SI Range | Status | Color |
| 0 – 3.4 seconds | Good | Green |
| 3.4 seconds – 5.8 seconds | Improvement Needed | Orange |
| 5.8 seconds – > 5.8 seconds | Poor | Red |

Difference between Visually complete and Speed Index:
Visually complete is a user experience metric that indicates when the visible area (known as above-the-fold or view-port) is fully rendered or or reaches visual completeness.
Whereas, Speed Index is a performance metrics that measure how quickly your web page renders the visible content in your user’s browser.

Why is a low-speed index score essential on your website?
A low page speed index score can enhance your User Experience (UX), boost Search Engine Optimization (SEO) ranking, improve conversion rate, provide greater visibility, and others. Let’s discuss it in detail.
- Enhance Your User Experience
A low-speed index indicates a high Google pagespeed insight score. So your website’s load time will decrease, which provides a better user experience. A fast-loading website improves user engagement with your website’s content.

- SEO Ranking
Page speed is considered one of the essential factors that Google considers in its Search Engine Optimization ranking algorithm. Although several factors can affect Google’s pagespeed insights score, the Speed Index (SI) is one of them.

- Conversion Rate
The conversion rate of your website measures the number of visitors who have completed the desired action of your website such as filling out a form, booking a demo, completing an online purchase, and many more. A high-loading speed website improves your average session duration in Google Analytics, which leads to a higher conversion rate.

A higher conversion rate will increase your leads as well as revenue.
3 Strategies to Optimize Your Speed Index Score
Now you have a basic idea of what is speed index and its importance. If you have a poor speed index score, it’s essential to optimize your speed index score to achieve a high pagespeed insights score as well as enhance web performance.
Let’s dig into the powerful strategies to achieve a good speed Index score.
Reducing JavaScript execution time to get maximum speed rating
When your user’s browser like Google Chrome finds a <script> tag during the HTML parsing, it pauses the whole process and starts to execute the JavaScript code. Hence, it affects your loading time.
There are several ways that you can follow to reduce JavaScript execution time.
- Implementing code-splitting:
Code-splitting is a method where your large JavaScript files split into smaller files so that only critical JavaScript code (which is essential to render the content above the fold) is executed during the initial page loading time.

- Caching your JS code with PRPL pattern:
4 key methods are involved in the PRPL pattern that can reduce your JavaScript execution time.
- Preloading important JavaScript files: It allows your Javascript to be downloaded fast and then executed late.
- Rendering the First Paint as soon as possible: Render-blocking resources such as JavaScript, CSS files, and much more need to be eliminated.
- Pre-caching assets: Caching is used to store the static content. So that, it renders the static content from the cache instead of downloading it again from the origin server.
- Lazy-loading JavaScript files helps you to reduce the initial loading time as the scripts are only loaded on demand.
Check Also: PageSpeed Optimization Services
- Minifying and Compressing JS Code
Minification is the technique of eliminating all unnecessary characters from your JavaScript code without modifying its functionality.
In simple words, minifying your code means removing all unnecessary comments, spaces, and punctuation.
Let’s understand with an example.
// add function

    const add = (a, b) => {

        return a + b

    }

    // call add function

    add(3, 4)
After minification this code will look: const add=(d,a)=>d+a;add(3,4);
How RabbitLoader will help you to reduce JavaScript execution time?
The above optimization techniques require a lot of coding knowledge. If you are not comfortable with coding, you can use an optimization plugin.
RabbitLoader uses the boolean attribute “defer” for your script tag in HTML to ensure the JavaScript file will parallelly download while the HTML document is parsing. Once the HTML parsing is complete, the Javascript execution will start.
Reducing unused Javascript can improve your pagespeed score
The most challenging suggestion triggered by Google PSI is to Reduce unused JavaScript when you are testing your website’s pagespeed performance.

Unused JavaScript (also known as dead code) refers to the code that is present in JavaScript files but not applied to any elements on your website. This dead code increases the overall JavaScript file’s size.
There are a couple of ways that you can use to reduce unused JavaScript:
- Tree shaking:
Tree shaking is the most used term for eliminating dead code. It depends on the static structure: export and import.
// default import

    import Navbar from 'Components'

    // named import

    import { Navbar } from 'Components'

// default export

    export default Navbar

    // named export

export { Navbar }- Load JavaScript asynchronously:
The best way to save network bandwidth time is by loading JavaScript asynchronously. You need to add async and defer to do this. These two attributes will handle your JavaScript downloading and execution in different order.
<script async defer src="bundle.js"></script>When you are installing RabbitLoader, you don’t worry about these time-consuming processes. RabbitLoader will take care of these for you.
Minimizing Main-thread work to improve website speed metrics
Minimizing main-thread work is also triggered by pagespeed insights when you are auditing your website’s pagespeed performance.

The browser tasks, that are executed on the main thread include, among the other tasks:
- Handling layouts
- Parsing CSS and HTML
- Executing all javascript files (by default).
Minimizing main-thread work is essential for optimizing the pagespeed score. Some of the strategies to achieve the above include:
- Reduce third-party scripts:
Third-party code consists of analytics services, ads, and other elements that are served from the other domain. These third-party scripts also have their own code and these will execute when a page is loading.
It is good practice to keep the third-party scripts that are adding value to your website and to remove the other third-party scripts.
- Debouncing your input handler:
Debouncing your input handler can minimize main thread work by avoiding long-running input handlers and avoiding style changes in input handlers.
RabbitLoader uses multithreading to minimize the main-thread works and improve the pagespeed performance.
How can RabbitLoader boost your SI score?
RabbitLoader is an all-in-one performance optimization tool. When you are using it, no other optimization tools are required for:
Image optimization
Minification of HTML, CSS, and JavaScript
Adding lazy loading
Generating critical CSS
Premium Content Delivery Network.
If you are not from a coding background, the best way to optimize your SI score is by using optimization plugin RabbitLoader. It will take care of everything that’s needed for optimal your website’s performance.
Get The Best PageSpeed Score
For Your WordPress Website