What Is Time To Interactive (TTI) & How To Optimize TTI To Improve The User Experience?
Google engineered the Time To Interactive (TTI) metric to analyze a web page’s load responsiveness. TTI helps you to identify the time delay from when the users start loading a web page till it becomes usable for the visitor.
Every user wants a website that is easy and fast to interact with. To prioritize this user requirement, Google added the TTI performance metric in the PageSpeed test. By optimizing the Time to Interactive (TTI) metric, you can boost your PageSpeed score as well as ellevate the user experience for your visitors.

Here, we will discuss everything you need to know about TTI and explore how you can optimize it with the help of RabbitLoader effortlessly. We will also explain the do-it-yourself strategies to improve TTI, that you can apply if you are comfortable dealing with a little bit of coding.
What Is Time To Interactive (TTI)?
Google developed a metric called Time to Interactive to determine the time difference between when a web page starts loading and when it is able to respond to user interaction. For example it is the time from when you try to open your favorite ecommerce store till the time when the buttons on the page become clickable.

According to Google if a website meets the below criteria, then it can be considered fully loaded:
- Browser renders any meaningful content on the web page.
- The web page can handle any event initiated by the end user.
- The page will respond to the user interaction within 50 milliseconds.
You need to keep in mind that TTI not only measures the initial loading time but also measures the page responsiveness.
The Difference Between TTI And FID
Although both performance metrics: TTI and FID are used to measure a website’s interactivity, there are some key differences in their functionality.
Get The Best PageSpeed Score
While the Time To Interactive (TTI) is used to measure the amount of time it takes a page to become fully interactive, the First Input Delay (FID) measures the time it requires a web page to respond to a user’s interaction. This can be analyzed with lab data; however, the FID can’t be calculated without field data.
Tools To Measure TTI
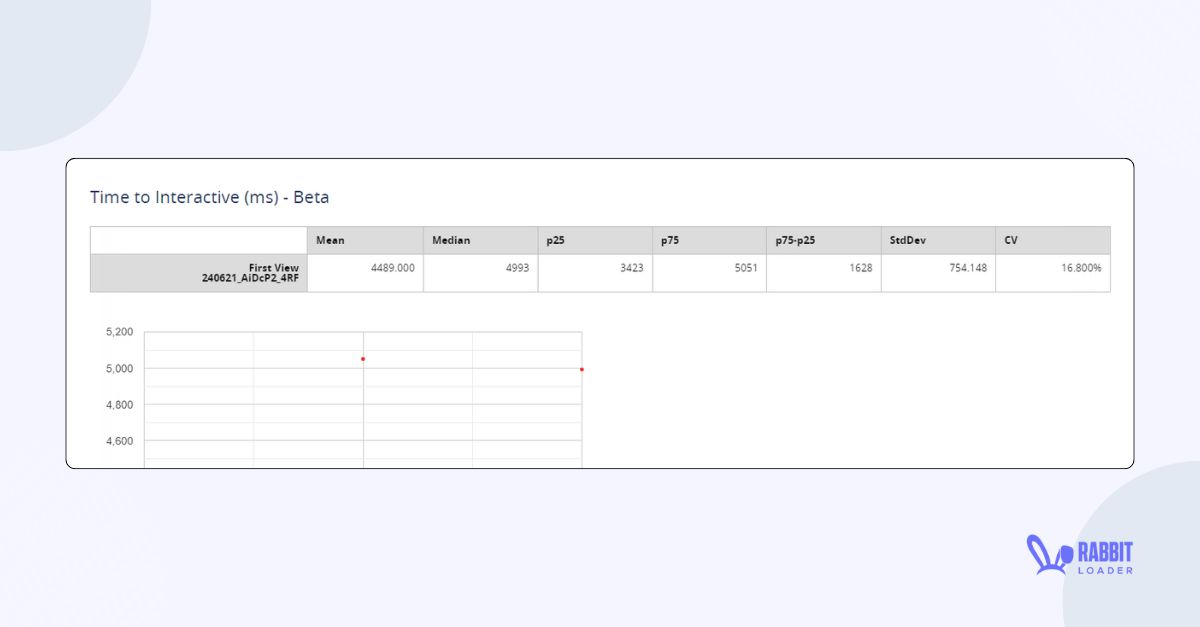
To measure the TTI performance for your website, you need to go to WebPagetest.org. Let’s see how it measures it in the WebPagetest.org.

First, enter your website’s URL and customize your test. Then click the Start Test button. After some time, your website’s PageSpeed performance will be shown. Then click on “plot Full results.” Then, you can see the performance of your TTI metric.

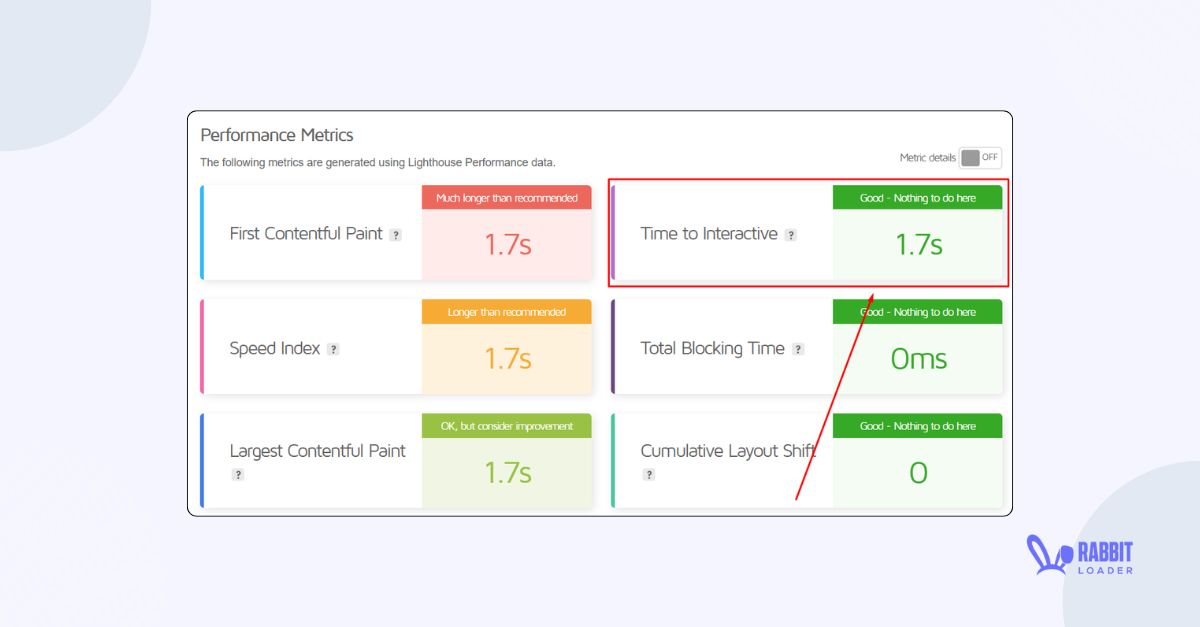
Note: you can’t see TTI performance in Google PageSpeed Insights. It has been removed from Lighthouse.
What Is An Ideal TTI Score?
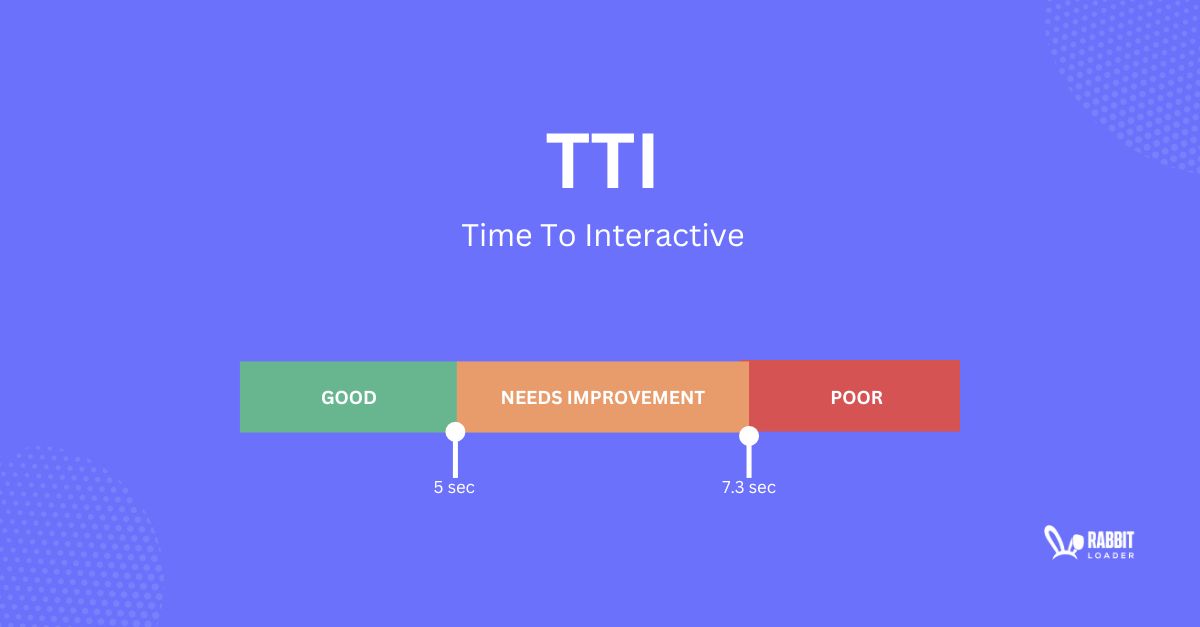
According to Google, to provide a better user experience your TTI time needs to be less than 3.8 seconds. Let’s see how Google classified this TTI score:
| TTI Score (seconds) | Remarks | Color |
| 0-3.8 | Good | Green |
| 3.8-7.3 | Needs Improvement | Orange |
| More than 7.3 | Poor | Red |
How To Optimize TTI With RabbitLoader
Follow the below strategies to optimize your website’s Time To Interactive performance manually. Otherwise, you can skip this part and just install RabbitLoader on your website.
Eliminate The Render-Blocking Resources
By eliminating render-blocking resources you can easily optimize your TTI performance. To eliminate the render-blocking resource, you need to optimize your CSS stylesheets and JavaScript files. To learn more, you can visit our blog on eliminate render-blocking resources.

If you want to avoid the manual process, then using RabbitLoader is the best option to eliminate the render-blocking resources.
Minimize Main Thread Work
“Minimize main thread work” is probably the very first warning you can see in the Google PageSpeed insights while analyzing your PageSpeed performance. During page loading, when the browser encounters any render-blocking resources, the main thread is blocked, slowing the website’s load time.

Implementing the above techniques (eliminating the render-blocking resource) would also help you to minimize the main thread work. If you want to know the main thread in detail, you need to read our Minimize main thread work blog.
When you use RabbitLoader to fix this “minimize the main thread work” warning, its multi-threading feature allows you to process other tasks when the main thread is blocked.
Reduce Initial Server Loading Time
To reduce your website’s initial server response time, you would need to implement strategies such as using a browser and CDN cache to reduce HTTP requests to the server and optimize resource files, especially CSS, JavaScript, and images manually.

However, if you are looking for an all-in-one solution, RabbitLoader is the best option for reducing initial server loading time and optimizing your TTI performance. For more details, go through our initial server response time blog.
Reduce Total Page File Size

Reducing the total page size can significantly improve the performance of TTI as well as the other performance metrics. Using an unoptimized resource file can significantly improve the total page file size.
How Does RabbitLoader Help Improve the TTI
To improve the TTI you would need to implement strategies such as adding your website to a CDN network, multi-threading and many more optimization techniques which are varied in complexity & needs specialized skill sets.
However, using RabbitLoader you can eliminate all the hard work with just a few clicks and improve TTI of your website & help it cruise pass the Core Web Vital test.